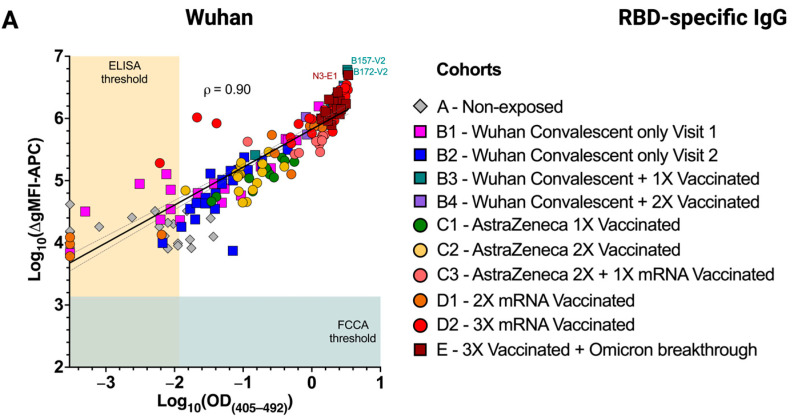
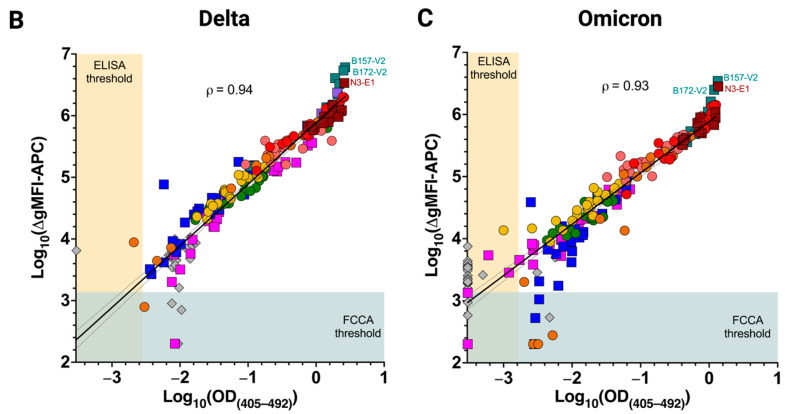
Figure 5.
Immunoreactivity of RBD-specific IgG determined by the FCCA correlates with results obtained by ELISA. Scatter plots show a high correlation of anti-RBD IgG levels determined by the FCCA and ELISA against (A) RBD-Wuhan-Hu-1, (B) RBD-Delta, and (C) RBD-Omicron. Each symbol corresponds to a distinct sample and its color depicts the sample group to which it belongs. Sera were diluted 1:100 for the FCCA and 1:200 for the ELISA, respectively. The x-axes show log10-transformed OD(405–492) values obtained by ELISA, while the y-axes represent log10-transformed ∆gMFI-APC values acquired with the FCCA. The horizontal blue color underlay represents the FCCA threshold, while the vertical ocher color underlay represents the ELISA threshold. Pearson’s correlation, ρ, and the linear regression line with 95% confidence intervals (dotted) are indicated in each graph.


