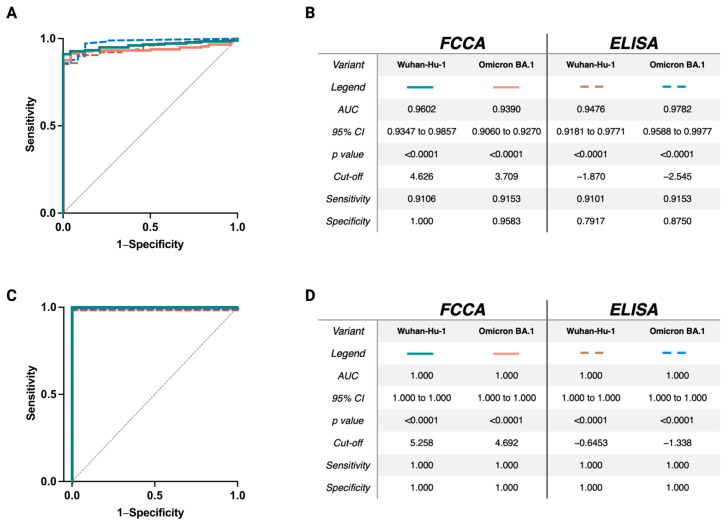
Figure 8.
Receiver operating characteristic (ROC) curves confirm the FCCA as a highly specific and highly sensitive assay for the determination of anti-RBD antibodies. Shown in (A,C) are the ROC curves of the FCCA (orange and green lines) and ELISA (brown and blue dotted lines) obtained by comparing the IgG reactivity against RBD-Wuhan (green and brown) and RBD-Omicron (orange and blue) of the non-exposed individuals (group A; n = 24) to (A) all convalescent and/or vaccinated individuals included in the study (groups B1-E; n = 179) and (C) 3X-vaccinated plus Omicron convalescent individuals (group E; n = 14). Grey diagonal lines show random classifiers. The tables in (B,D) show the area under the curve (AUC), 95% confidence intervals, p values, cut-offs for the determination of seropositivity, and the respective sensitivity and specificity.

