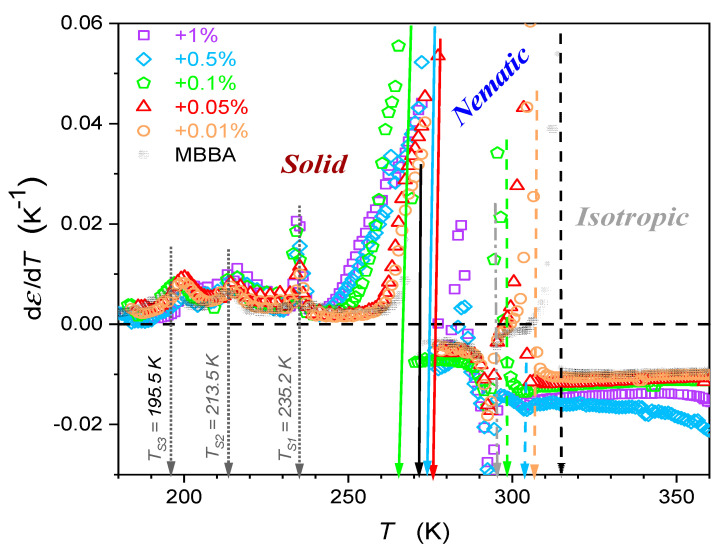
Figure 5.
Temperature changes in dielectric constant derivatives of MBBA and its nanocolloids with BaTiO3 nanoparticles. Concentrations are given in the plot. Dashed arrows indicate transitions between the isotropic liquid and nematic phases, and solid arrows indicate nematic–solid phase transitions. Values of and temperatures are given in Table 1. Dotted arrows indicate phase transition in the solid phase, with phase transition temperatures. The dashed-dotted arrow (in grey) indicates the transformation within the nematic phase, associated with .

