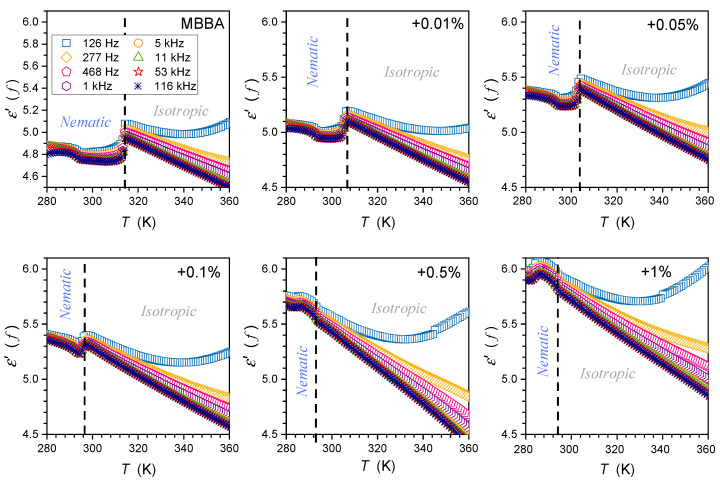
Figure 9.
Temperature changes in the real part of dielectric permittivity in the isotropic liquid and nematic phases of MBBA and its nanocolloids with BaTiO3 nanoparticles for concentration (in mass fractions) frequencies given in the plot. The latter extends from the static to the low-frequency domain. For each figure, the same ranges are presented.

