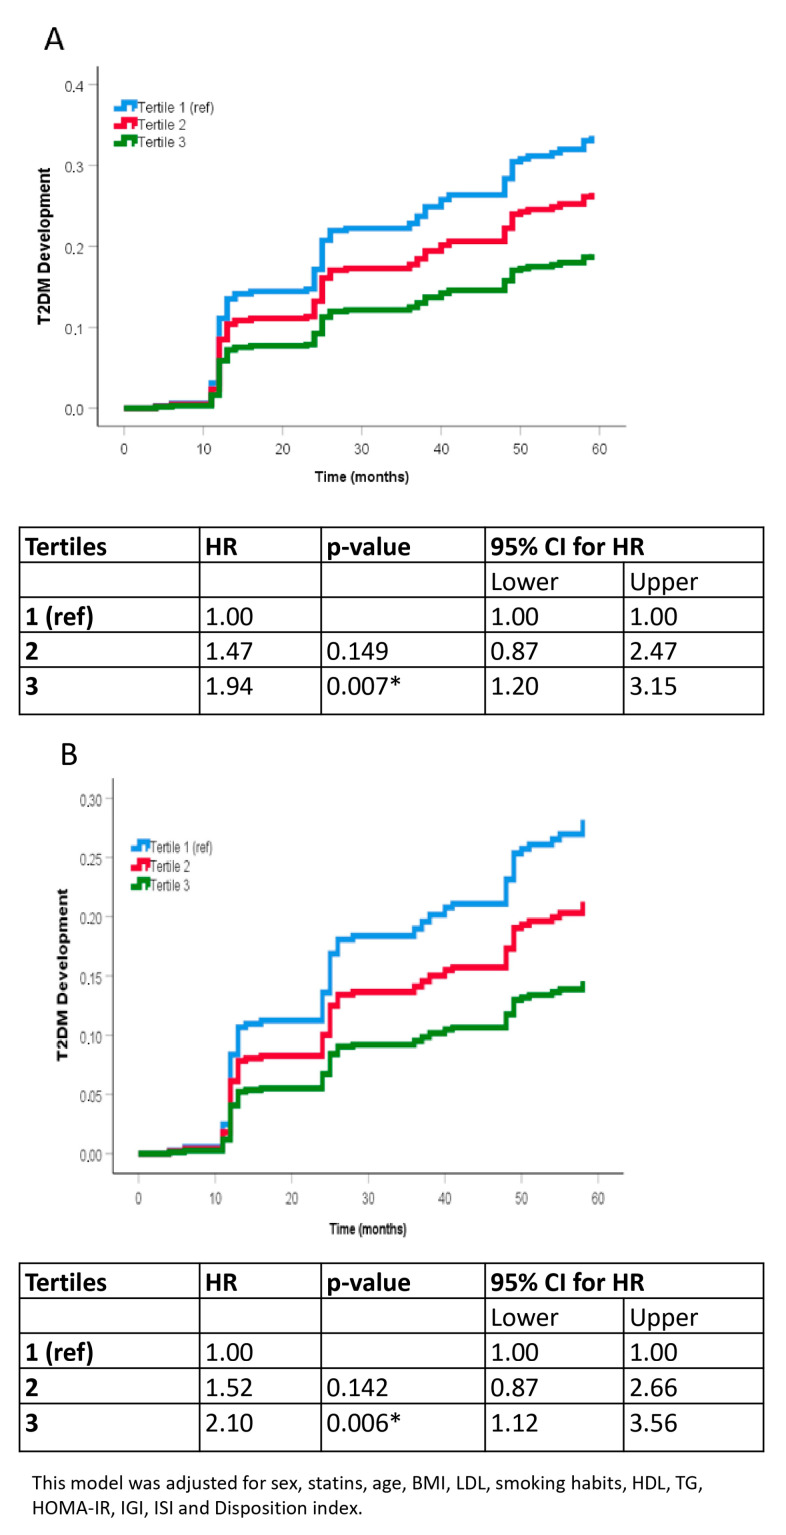
Figure 2.
Probability of T2DM development by COX analysis according to the tertiles of ΔNRF9.3. (A) unadjusted model. (B) adjusted model controlled for sex, statins, age, BMI, LDL, smoking habits, HDL, TG. C fully adjusted model controlled for sex, statins, age, BMI, LDL, smoking habits, HDL, TG., HOMA-IR, ISI, DI and IGI. Reference was the Tertile 1 (lowest). The hazard ratio (HR) between groups was calculated. Abbreviation: BMI, Body mass index; LDL, Low-density lipoprotein; HDL, high-density lipoprotein; TG, Tryglicerides, HOMA-IR, homeostatic model assessment; ISI, insulin sensitivity index; DI, disposition index; IGI, insulinogenic index. * p < 0.05.

