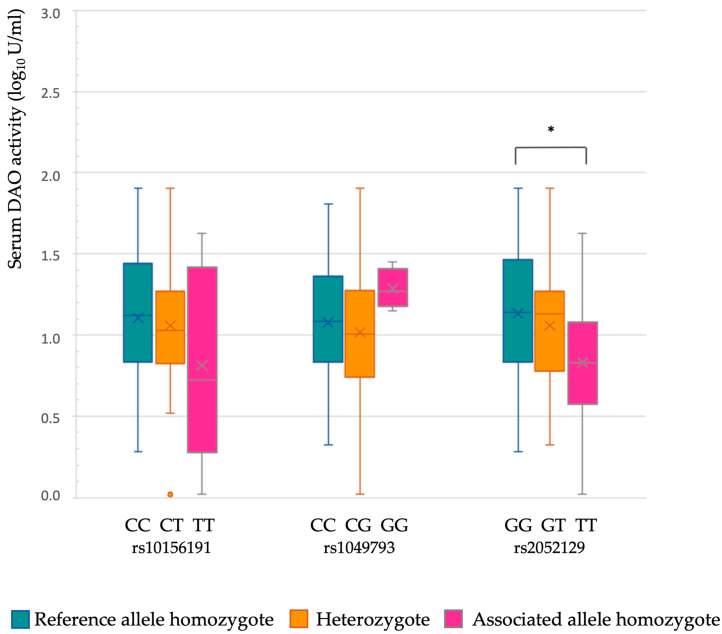
Figure 4.
Distribution of logarithmic transformation of serum DAO activity data according to the allelic load of each different gene variant. * Asterisk indicates statistically significant differences (p < 0.05), according to the ANOVA and subsequent Tukey post-hoc tests. Variables of sex and age were not confounding factors according to a general linear model (p > 0.05).

