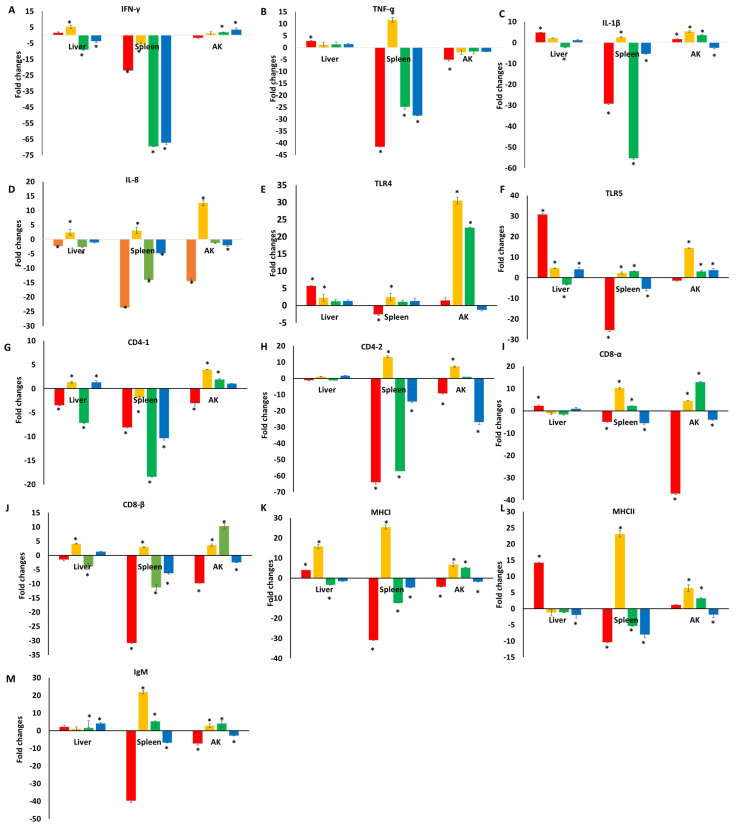
Figure 1.
Gene expression profiles in the liver, spleen, and anterior kidney (AK) of channel catfish fingerlings that received a TC-supplemented diet as compared to those in catfish fed a normal diet on days 1 (red), 7 (orange), 14 (green), and 21 (blue). Each subfigure (A–M) represents the expression level of one gene. Data are represented as fold change in gene expression over the control group ± standard error. Four technical replicates were analyzed from a pool of ten catfish per time point. * p < 0.05, two-tailed Student’s t-test.

