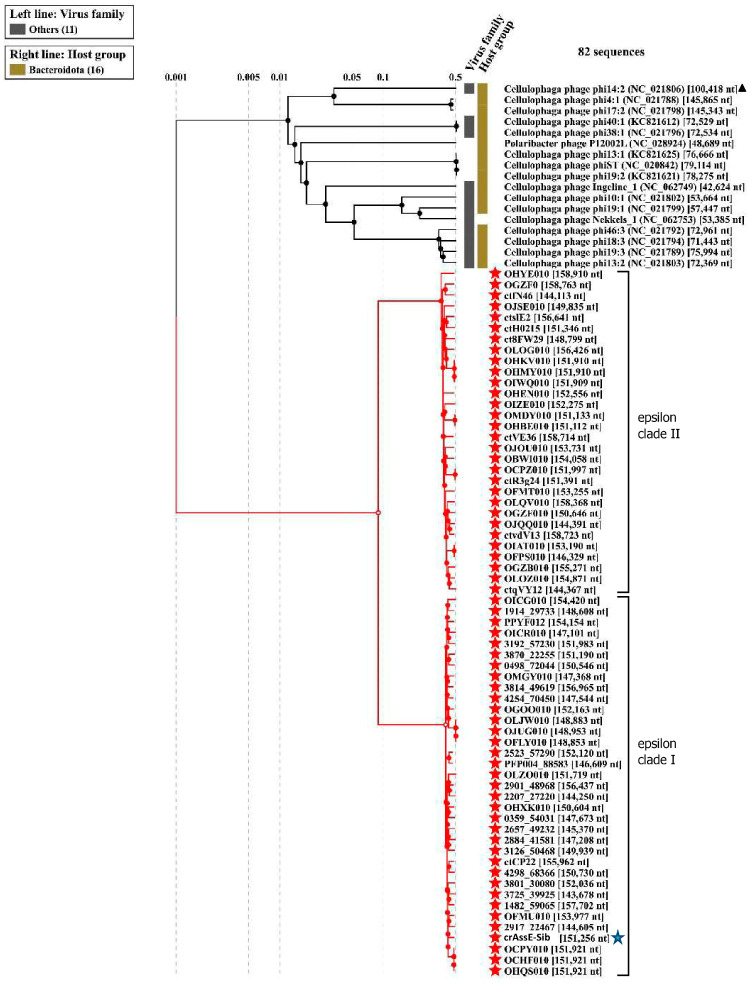
Figure 2.
ViPTree analysis of the crAssE-Sib phage. Dendrogram plotted by ViPTree version 3.7 using crAssE-Sib and phages with SG values > 0.001. The crAssE-Sib phage is marked with a blue asterisk; phi14:2 phage is marked with a black triangle; phage sequences that were downloaded from the NCBI GenBank manually are marked with red phylogenetic branches.

