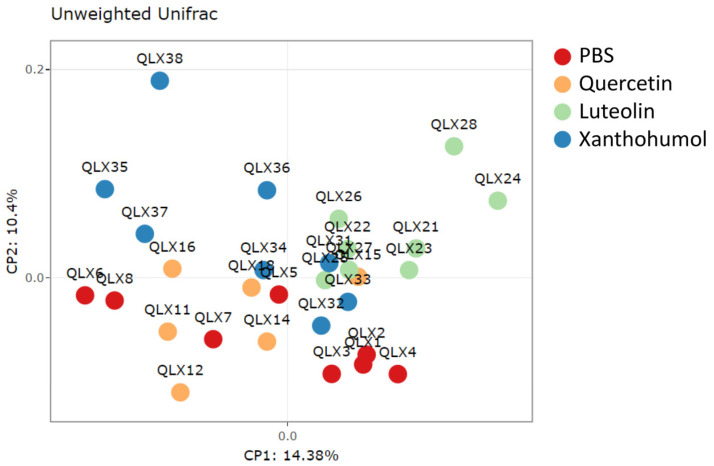
Figure 4.
PCoA plot showing structural variations within microbial communities measured using the unweighted Unifrac beta diversity index. Each dot labeled with “QLX” and a numerical identifier indicates an individual participant in the experiment. Specifically, red dots represent CRC-induced animals in the PBS-treated cohort, orange dots belong to CRC-induced quercetin-treated animals, green dots correspond to CRC-induced luteolin-treated animals, and blue dots represent CRC-induced individuals of the xanthohumol-treated cohort.

