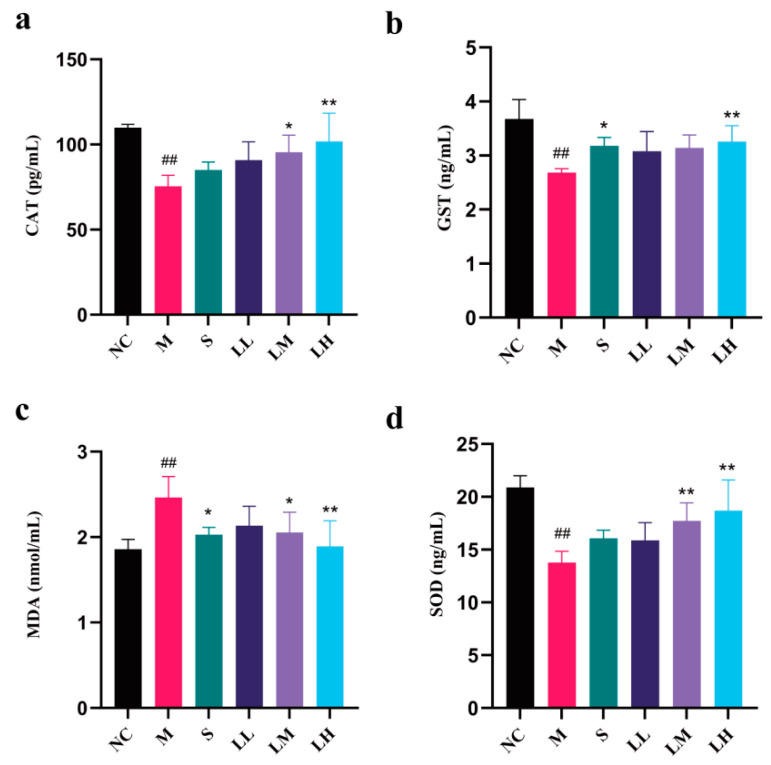
Figure 4.
Changes in CAT, GST, MDA, and SOD contents in liver tissue from C57BL/6J mice after administering 15 mL of ethanol/kg body weight. (means ± SD, n = 6). (a) CAT content; (b) GST content; (c) MDA content; (d) SOD content. ## p < 0.01 vs. the normal control group; * p < 0.05, ** p < 0.01 vs. the model group.

