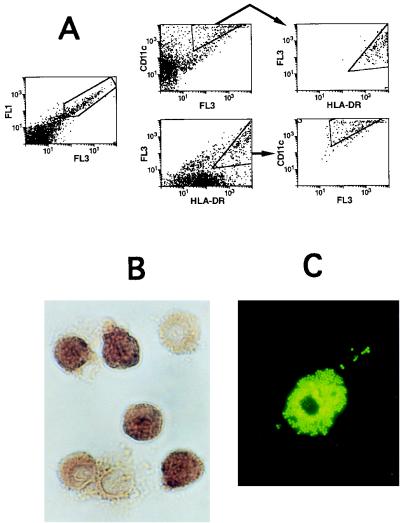
FIG. 4.
Analysis of thymic autofluorescent cells. (A) Flow cytometric analysis of CD11c and HLA-DR expression on autofluorescent SCID-hu Thy/Liv cells with high side scatter. (Left) By using mock channels (25), autofluorescent cells are revealed (within gate). (Middle, top row) Cells were analyzed for staining with a CD11c MAb (y axis) versus a mock channel (x axis). CD11c+ autofluorescent cells were gated and analyzed for HLA-DR expression (right; x axis); 95% of CD11c+ cells were HLA-DR+. (Middle, bottom row) Flow cytometric analysis of the same cells, analyzed for staining with the HLA-DR MAb (x axis) versus a mock channel (y axis). HLA-DR+ autofluorescent cells were gated and analyzed for CD11c expression (right; y axis); 69% of HLA-DR+ cells were CD11c+. (B) Sorted autofluorescent cells were stained for NSE (brown color). (C) Sorted autofluorescent cells were cultured overnight, rinsed, and incubated with 1-μm yellow-green microspheres for 6 h. Adherent cells which phagocytosed the microspheres are visible under dark field.

