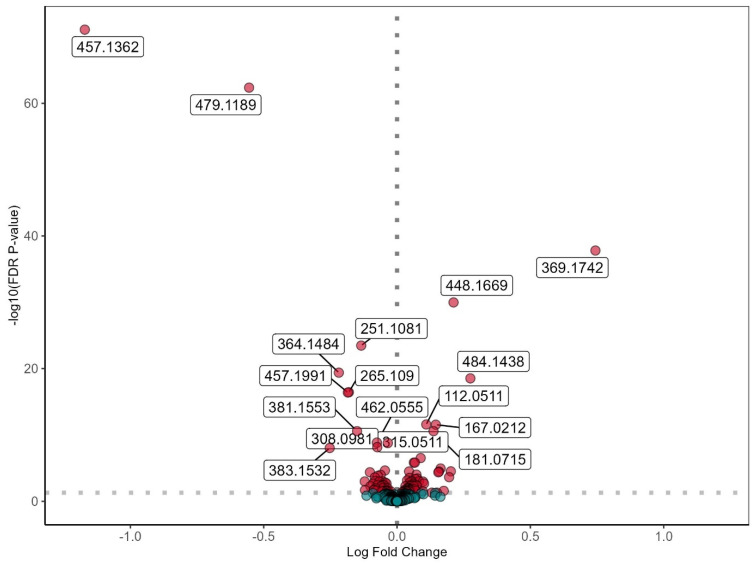
Figure 1.
Differentially expressed metabolites in INSTI users compared to NNRTI users in the discovery cohort (INSTI n = 721; NNRTI n = 612). Differential expression analysis using a linear model with sex at birth and age as covariates on 500 metabolites known to be present in serum. Y-axis shows the FDR-corrected p-value through −log10(FDR), x-axis shows the log fold change. Horizontal dotted line represents border of significance (FDR corrected p-value < 0.05), vertical dotted line represents border between higher levels (right) and lower levels (left) of metabolites in the INSTI group. Significantly differentially expressed metabolites are shown in red. Non-significant metabolites are shown in green. Numbers specify the significant differentially expressed ion m/z ratio, using untargeted metabolomics. In the discovery cohort, 59 metabolites were significantly higher, and 45 metabolites were significantly lower in INSTI users compared to NNRTI users.

