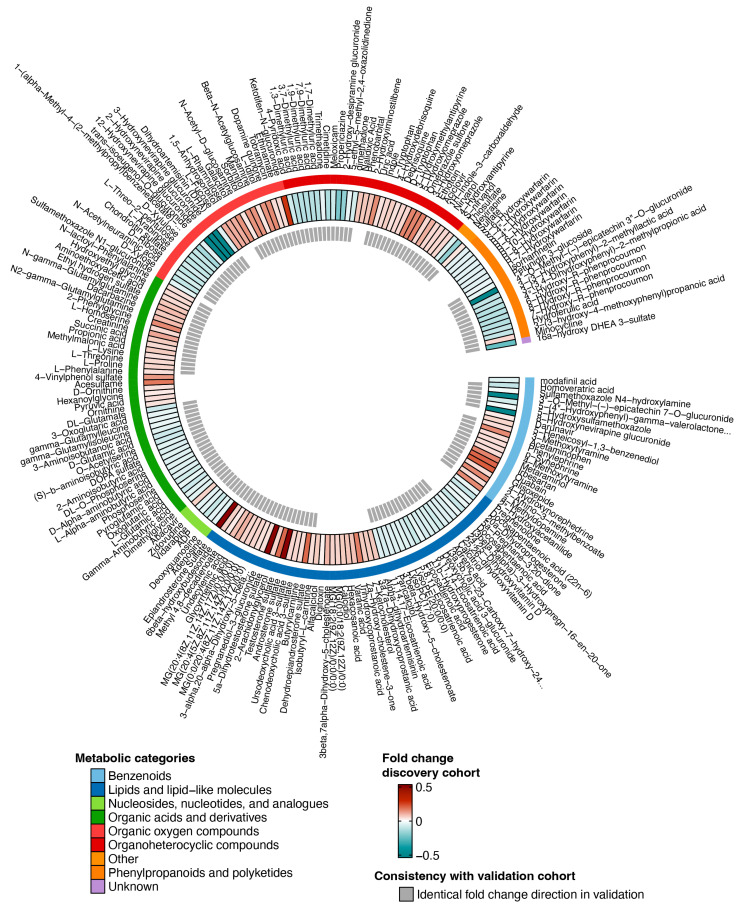
Figure 2.
Differentially expressed annotated metabolites in INSTI users compared to NNRTI users in the discovery cohort (INSTI n = 721; NNRTI n = 612) after differential expression analysis on metabolites. Annotated metabolite names are shown on the outside. Three-layer heatmap displays, in order from outside to inside, category of the metabolite, the fold change in the discovery cohort and consistency in directionality in the validation cohort.

