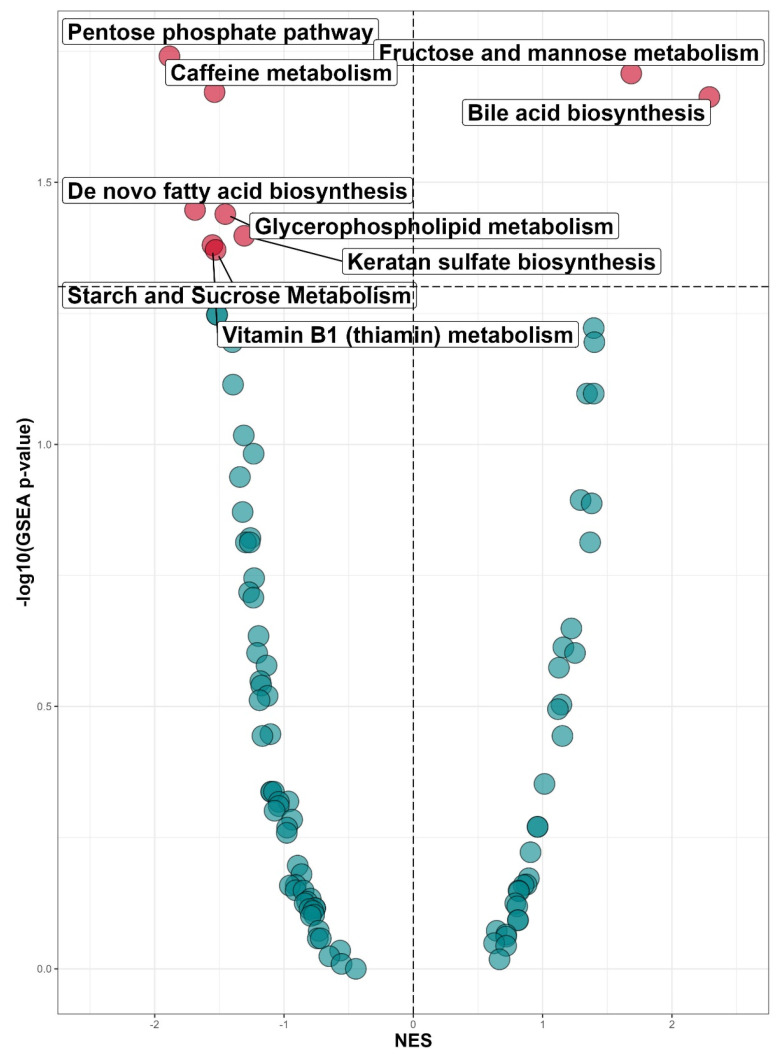
Figure 3.
Up- and downregulation of metabolic pathways in INSTI users compared to NNRTI users in the discovery cohort (INSTI n = 721; NNRTI n = 612) using MetaboAnalyst software. Y-axis shows p-value through −10log(p-value), with the horizontal dotted line the threshold for significance (p < 0.05). X-axis indicates a normalized enrichment score (NES). Positive NES indicates an upregulation, and a negative NES indicates downregulation. Red dots indicate significantly differentially expressed pathways. In the discovery cohort, seven pathways were significantly downregulated, two pathways were upregulated in INSTI users compared to NNRTI users.

