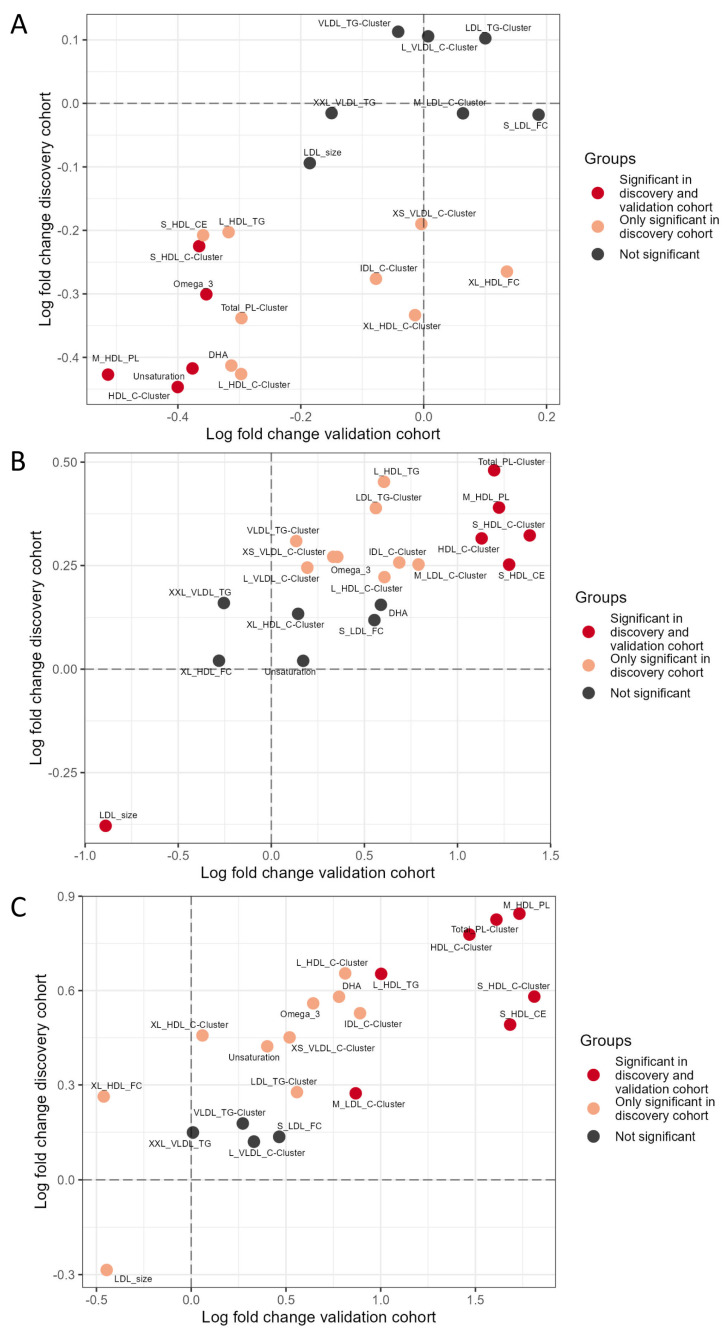
Figure 4.
Differential expression of targeted lipoprotein and lipid analysis in INSTI users, NNRTI nevirapine users and NNRTI doravirine users. Differential expression analysis using a linear model with sex at birth and age as covariates on twelve lipoproteins and lipid cluster representatives and nine individual uncorrelated lipoproteins and lipids. Lipoproteins and lipids included per cluster can be found in Supplementary Table S1. Y-axis demonstrates the log fold change in the discovery cohort, the X-axis shows the log fold change in the validation cohort. Dot color indicates whether lipoproteins and lipids were significant differentially expressed in both the discovery and validation cohorts (red), only the discovery cohort (orange) or not significant in the discovery cohort (black). (A): Comparison of lipoprotein and lipid levels in INSTI users compared to NNRTI nevirapine users. (B): Comparison of lipoprotein and lipid levels in INSTI users compared to NNRTI doravirine users. (C): Comparison of lipoprotein and lipid levels in NNRTI nevirapine users compared to NNRTI doravirine users.

