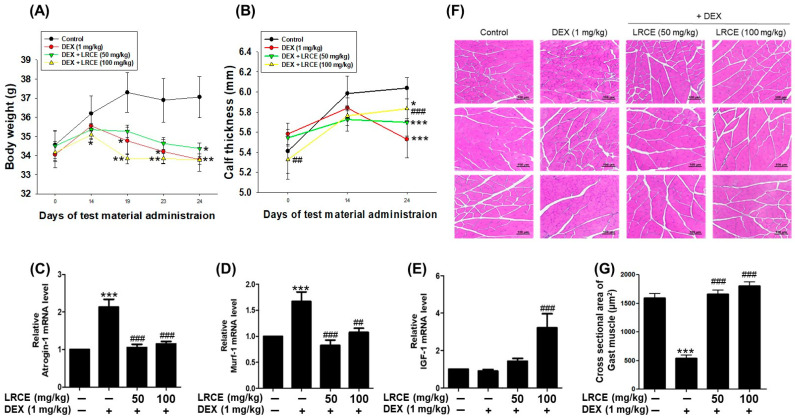
Figure 7.
Effects of LRCE on DEX-induced muscle atrophy in mice. (A) Body weight. (B) Calf thickness. qRT-PCR analysis for expression of (C) atrogin-1, (D) MuRF1, and (E) IGF-1 in gastrocnemius muscle. (F) Representative hematoxylin and eosin (H&E) staining of myofiber cross-section of the gastrocnemius muscle (scale bar = 100 μm). (G) Quantitative analysis of the cross-sectional area in the gastrocnemius muscle. These results are presented as means ± SD. * p < 0.05, ** p < 0.01, *** p < 0.001 vs. control; ## p < 0.01, ### p < 0.001 vs. DEX.

