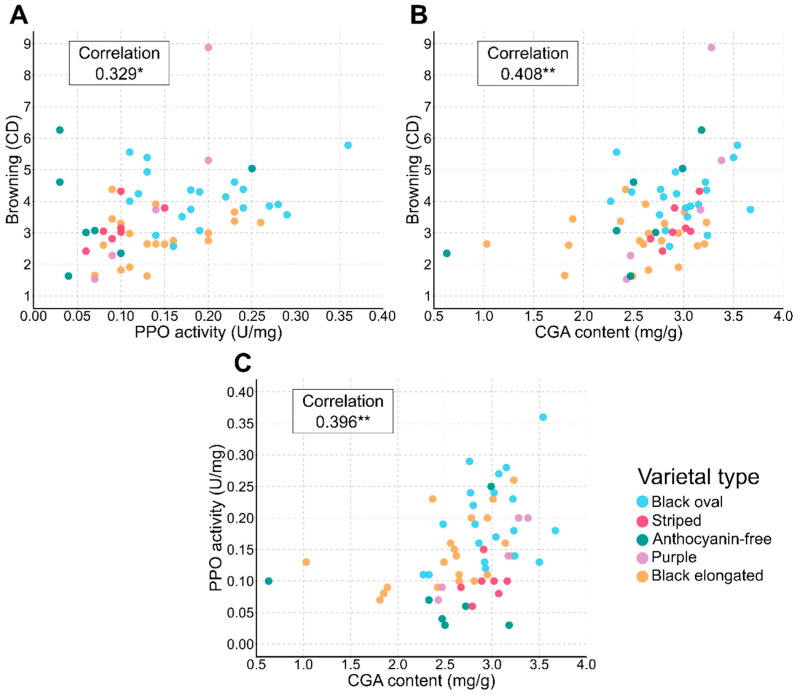
Figure 3.
Scatter plots of mean values with Pearson correlations of browning (CD) and PPO activity (U/mg) (A), browning (CD) and CGA content (mg/g) (B), and PPO activity (U/mg) and CGA content (mg/g) (C). Each dot represents an individual accession, color-coded by varietal type: ‘black oval’, ‘striped’, ‘anthocyanin-free’, ‘purple’, and ‘black elongated’. Significant pairwise trait correlations are marked accordingly (“*” p-value < 0.05, “**” p-value < 0.01).

