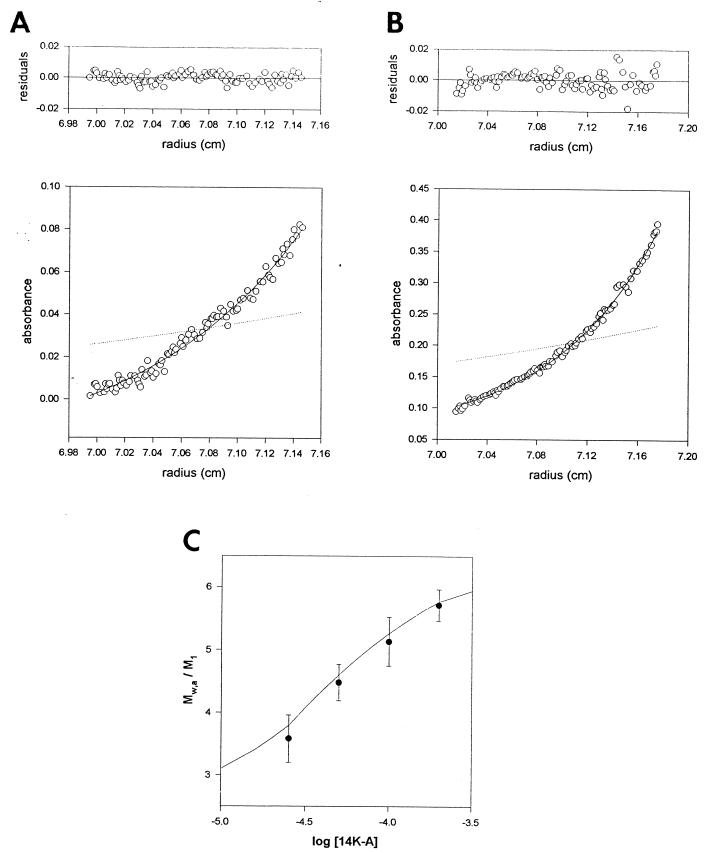
FIG. 4.
Sedimentation equilibrium analysis of the 14-kDa protein. (A) Sedimentation equilibrium profile of the 14K-A protein at a concentration of 20 μM in 20 mM Tris-HCl (pH 7.4) buffer at 25,000 × g, 20°C, as described in Materials and Methods. The symbols represent the experimental data. The solid line shows the best-fit function corresponding to a single species at sedimentation equilibrium with an MW of 43,500. The dotted line represents the concentration gradient of the monomer protein (M1 = 12,500). (B) The same as described for panel A with 150 μM 14K-A protein. In this case, the Mw was 69,100 ± 3,000. (C) Dependence of the degree of association (Mw/M1) of the 14-kDa protein on protein concentration. The solid line shows the best-fit function for a trimer-hexamer association (2 × 10⁴ M−1) at sedimentation equilibrium.

