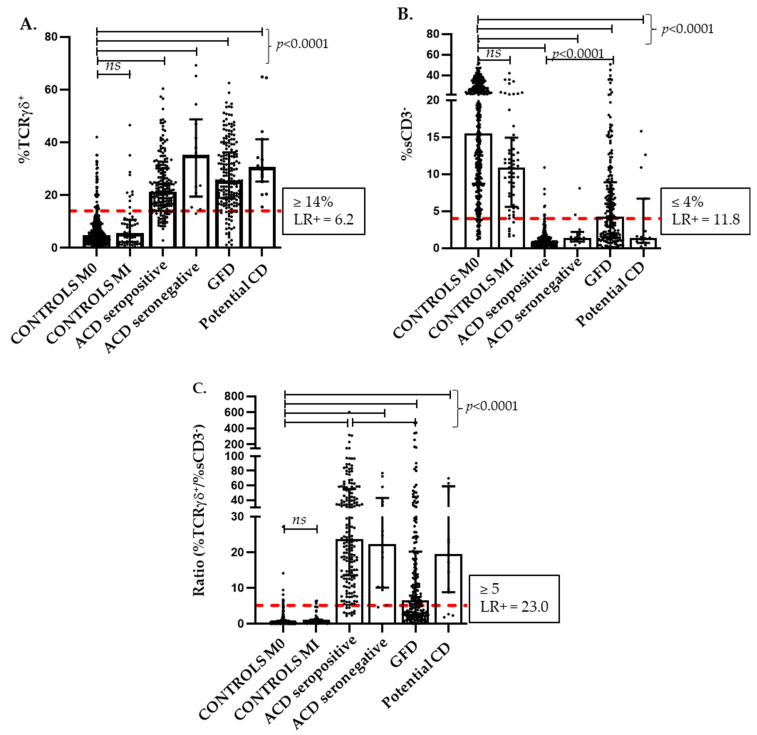
Figure 1.
Distribution of the TcRγδ (A) and sCD3− (B) IEL subset percentages and of the calculated ratio between % TcRγδ+/% sCD3− (C) in the different forms of celiac disease and the controls. % TcRγδ+ and % sCD3− IEL densities are expressed as a percentage of the total intraepithelial lymphocytes. Discriminative cut-offs are indicated as dashed lines on the y-axes and are calculated by ROC curve analysis. Median and quartiles are shown over the individual pointed data. ACD, active celiac disease; CD, celiac disease; GFD, gluten-free diet; M0, Marsh type 0; MI, Marsh type I; and ROC, receiver-operating characteristic curve. p values were calculated using the non-parametric ANOVA (Kruskal–Wallis) test, ns: not statistically significant.

