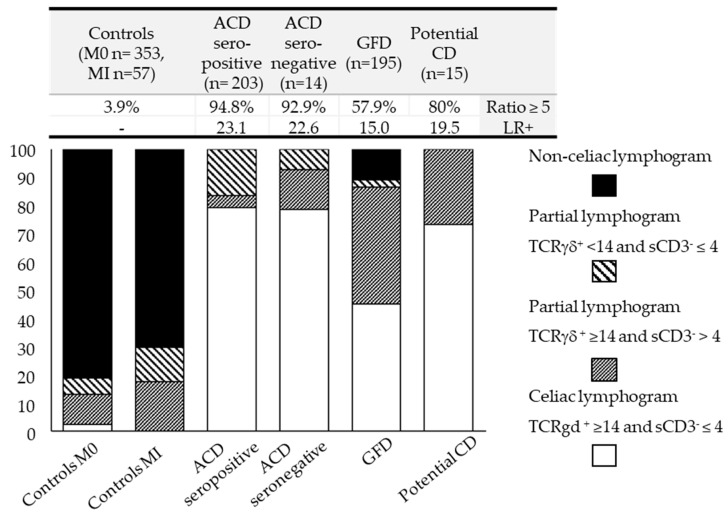
Figure 2.
Distribution of the four different lymphogram profiles in the different forms of celiac disease and the controls. Lymphogram profiles combine TcRγδ and sCD3− IEL variables according to their compliance with the established cut-offs. The data table at the top of the figure shows the percentage of patients in each group that meet the TCRγδ/sCD3− ≥ 5 ratio requirement and the calculated diagnostic accuracy (LR+) for each one. ACD, active celiac disease; CD, celiac disease; GFD, gluten-free diet; and LR+, positive likelihood ratio.

