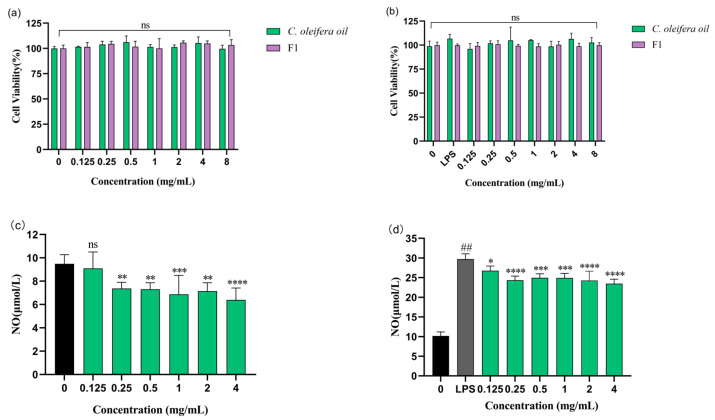
Figure 4.
Effect of CO oil and F1 on the cell viability. (a) RAW 264.7 cells were incubated with various concentrations of CO oil or F1 for 24 h. (b) RAW 264.7 cell were co-cultured with LPS and CO oil or F1 for 24 h. (c) RAW 264.7 cells were cultured with CO oil for 24 h and NO secretion was measured by the Griess reagent. (d) RAW 264.7 cells were cultured with CO oil with LPS stimulation for 24 h. LPS-stimulated NO secretion was measured by the Griess reagent. Values are means ± SD; n = 5. Note: ns means not significant. F0 means emulsion without CO oil; F1 means emulsion with CO oil. ## means comparison with blank control p < 0.0001; * means comparison with LPS-stimulated p < 0.05; ** p < 0.01; *** p < 0.001; **** p < 0.0001.

