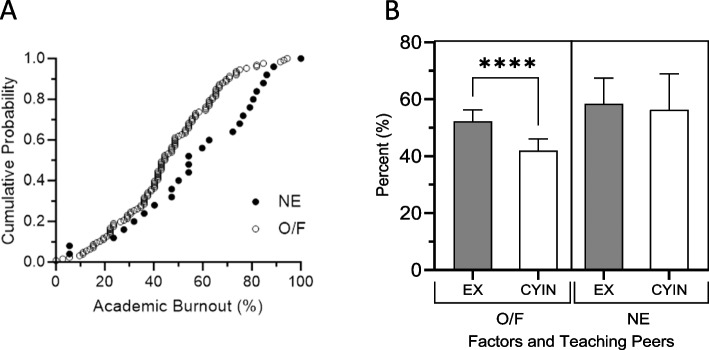
Fig. 3.
A The academic burnout percent value of each medical student in the population’s offering peer-teaching (O/F) and those never do that (NE). The academic burnout percent value of each medical student (MS) in the population’s offering peer-learning (O/F) and those never do that (NE). The figure shows cumulative probability of the percentages of academic burnout (ABO) within the medical student population, specifically those who indicated that they never taught their peers—NE (Fill circles) and those who reported doing so frequently or occasionally—O/F do informal peer learning (clear circles). Results presented excluding the EX3 item based on the findings of the CFA (model M2). The O/F student group is shifted to the left, indicating a lower average ABO value. The mean percentage values, standard deviations (SD), and sample sizes for the O/F population were 44.75 (18.50) N = 126, while for the NE population they were 54.89 (23.71) N = 25. The O/F population had a statistically significant lower proportion of academic burnout compared to the NE population (p < 0.0133). B Factors Fc1 and Fc2 (EX and CYIN) involved in academic burnout and the relationship with students who taught their peers (O/F) and those of students who did not informally tutor their peers (NE). Factors (EX and CYIN) involved in academic burnout. In the left part, the figure shows the relationship of students who do informal peer learning (IPAL) to their peers (O/F) and those who did not do so (NE). When analyzing the students who do IPAL, the percentage of Fc2 is statistically lower p < 0.001 compared to the Fc1: 41.98 (23.41) vs 52.25 (22.42) N = 126. On the other hand, in students who do not take IPAL, there is no significant difference in the percentages of Fc2: 56.33 (30.65) vs Fc1: 58.33 (22.05) N = 25. Values represent, the mean percentage values, standard deviations (SD), and sample sizes

