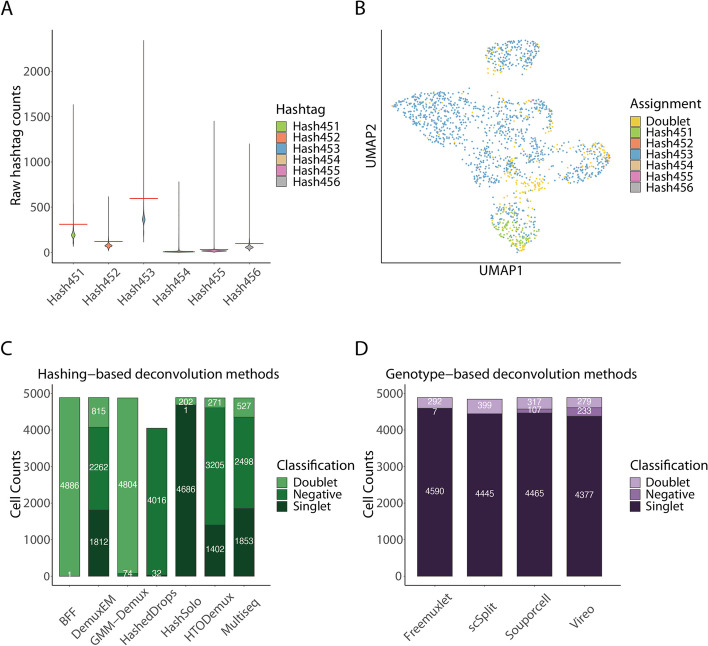
Fig. 2.
Comparison of the performance of donor deconvolution methods. A The violin plot of raw HTO counts shows high count levels of Hashtag 453 in cells with noisy or undetectable expression of the other HTOs. B UMAP visualization of normalized HTO counts colored by HTODemux assignment shows poor separation of the cells based on hashtags, with most droplets assigned to Hashtag 453. C Hashing-based deconvolution methods show the inconsistent assignment of cells, reported as the different proportions of cells identified as one of either singlet, negative, or doublet. D Genetic deconvolution tools show a more consistent assignment of the cell mixture to singlets, doublets, and negatives

