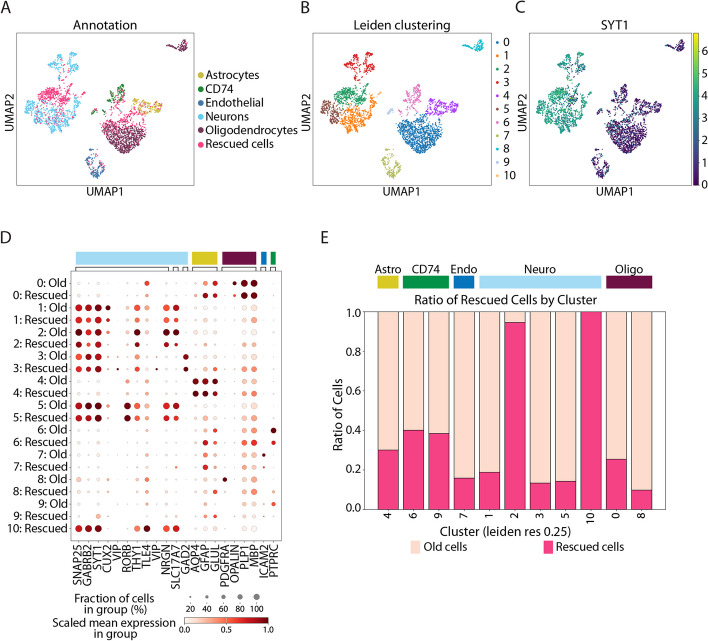
Fig. 4.
Recovered cells recapitulate known cell types. A UMAP of the single-cell gene expression data with old and rescued cells. B Leiden clustering of the dataset with old and rescued cells. C SYT1 expression defines rescued cells as a new cluster of neurons. D Dotplot of a selection of marker genes shows concordant expression of markers in old and rescued cells. E Barplot showing the cluster composition in old and rescued cells, with two neuronal clusters enriched for rescued cells. Colors on top of the barplot identify the cell annotation from A

