Figure 3.

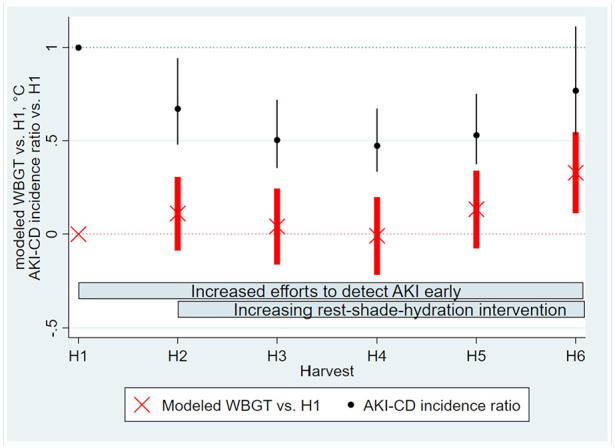
Trends in heat and hospital-evaluated acute kidney injury during the study period. Bars denote 95% confidence intervals, black denoting AKI-CD incidence ratio and red the modeled noon WBGT.

Trends in heat and hospital-evaluated acute kidney injury during the study period. Bars denote 95% confidence intervals, black denoting AKI-CD incidence ratio and red the modeled noon WBGT.