
Figure 3. ‘High reductase’ gut bacteria utilize diverse respiratory electron acceptors.
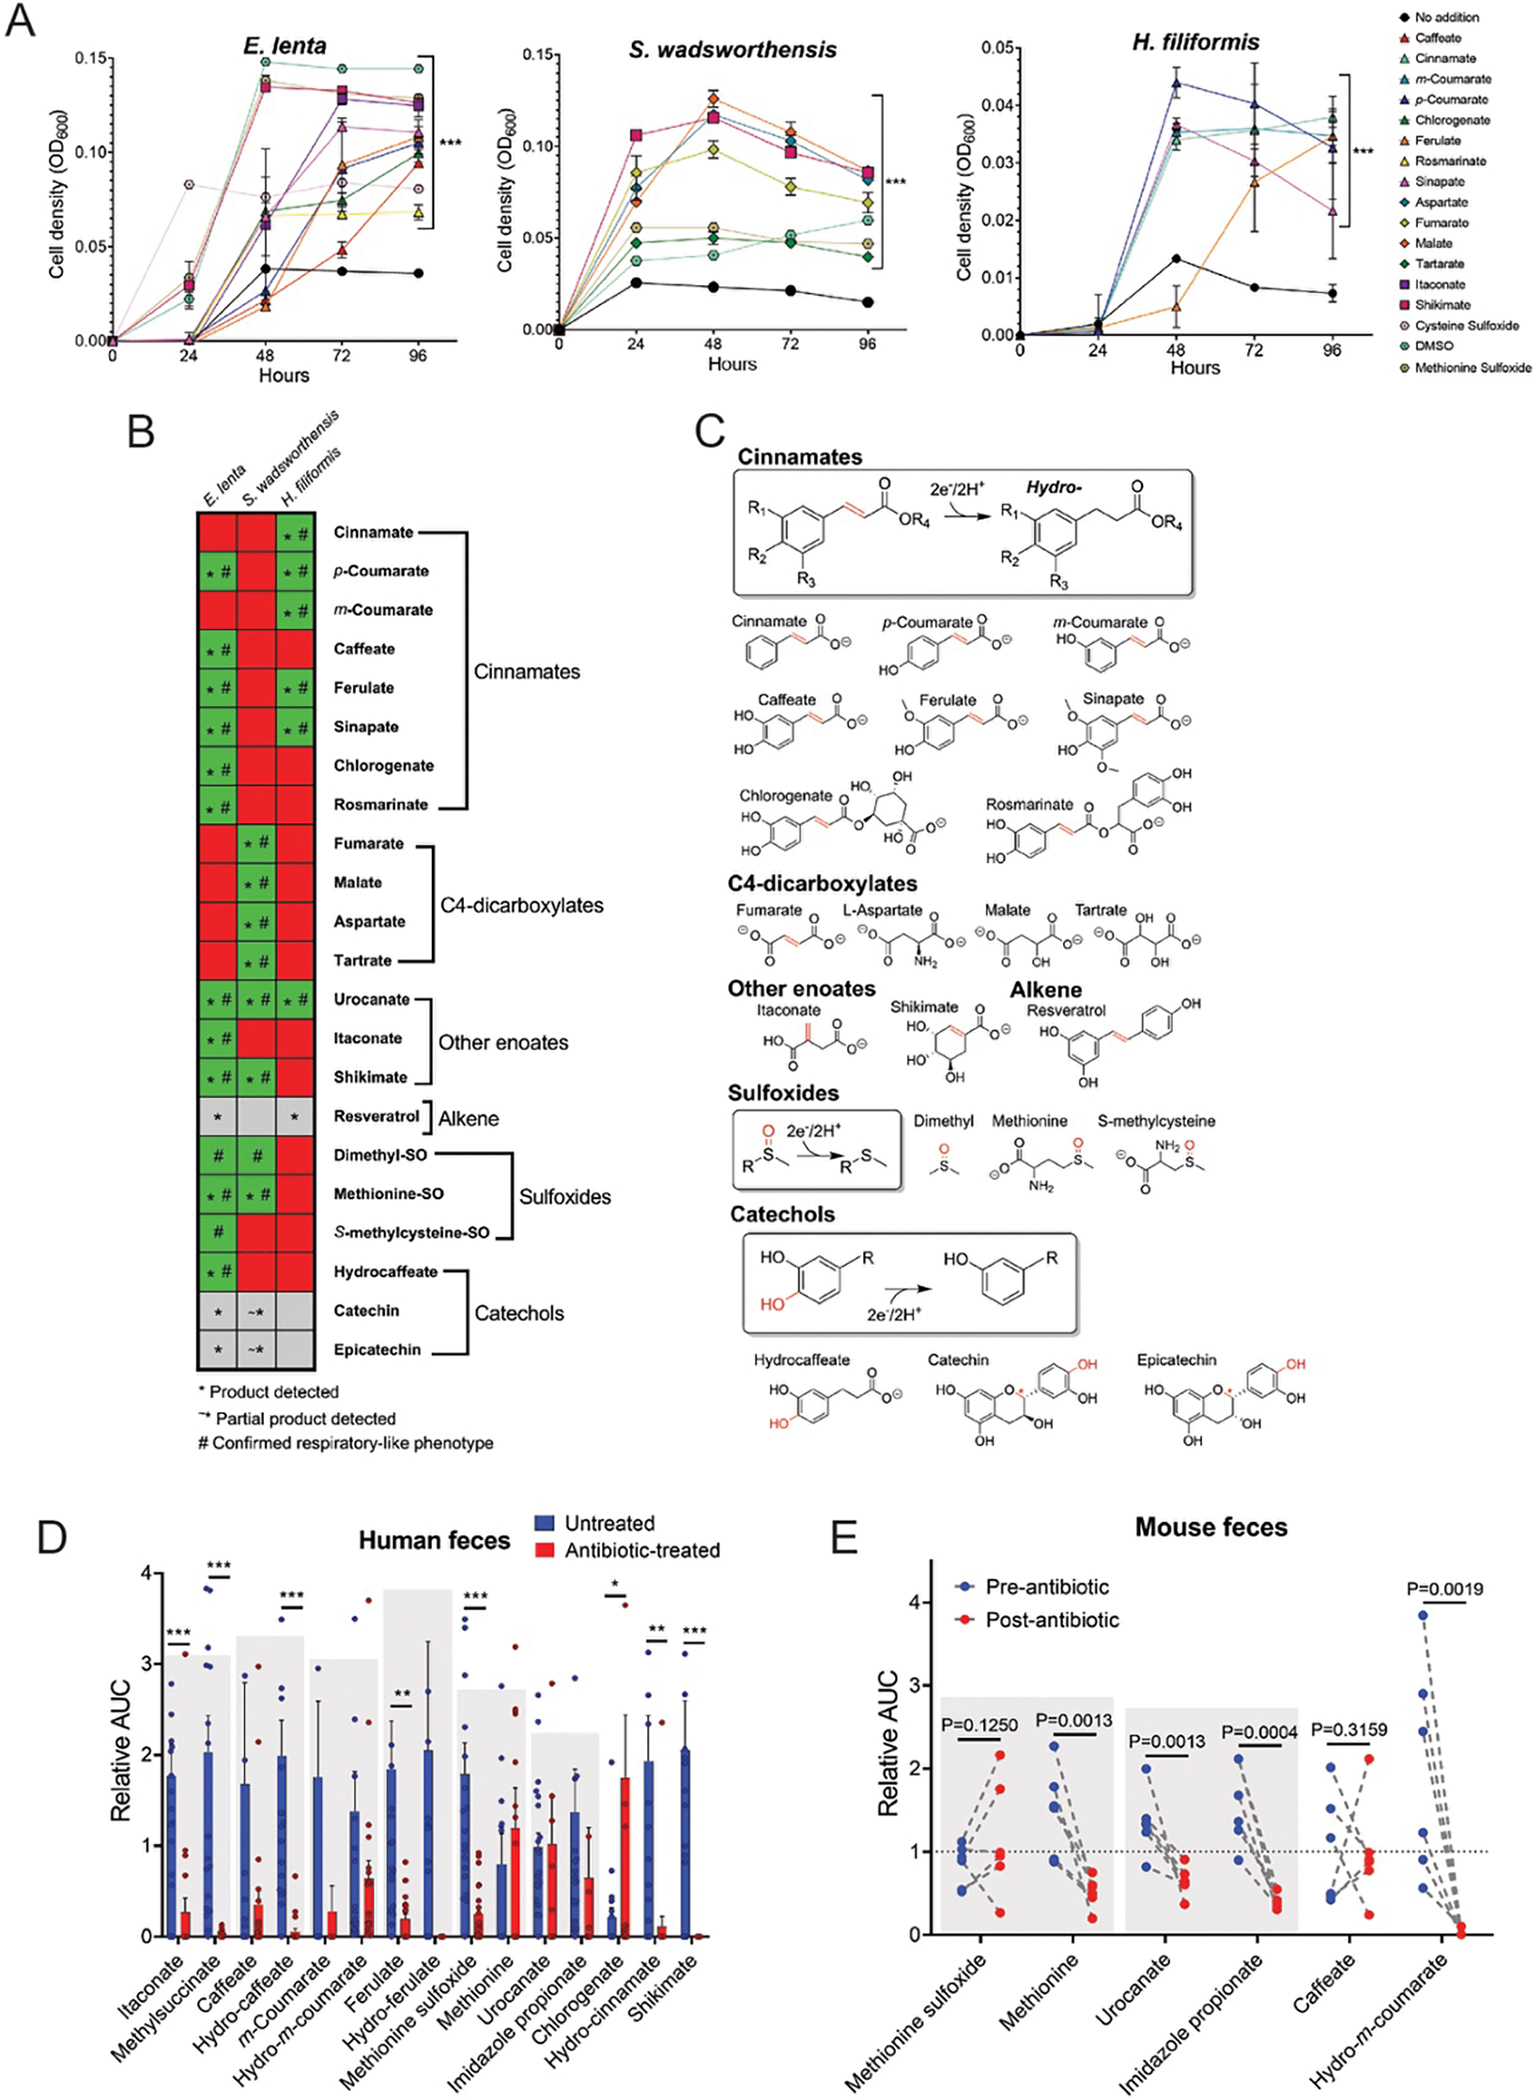
(A) E. lenta DSM2243, S. wadsworthensis DFI.4.78, and H. filiformis DFI.9.20 growth in media supplemented with formate and identified growth-stimulating small molecules. (B) Summary of electron acceptor usage findings. Green indicates growth enhancement, red indicates no enhancement, and grey denotes limited solubility. The symbol * indicates the reduced product was detected after growth, and the symbol # indicates a confirmed respiratory phenotype. (C) Summary of identified reductase activities. The electron-accepting bond is highlighted in red. The red symbol * for both catechin and epicatechin denotes the site of benzylic C-O cleavage. (D) Identified metabolites in fecal samples collected from non-antibiotic versus antibiotic treated subjects as measured by LC-MS. Area under the curve (AUC) values are presented relative to each metabolite’s normalized average (normalized to 1) within the dataset as measured by LC-MS. See Supplementary Table 4 for original data. (E) Identified metabolites in mouse feces pre- and post-antibiotic treatment. Area under the curve (AUC) values are presented relative to each metabolite’s normalized average (normalized to 1) within the dataset. Gray boxes highlight reductase substrate and product pairs. See Supplementary Table 5 for original data. For (A) data are mean ±SD (n = 3 independent biological replicates) with two-way ANOVA, multiple test vs media alone. For (D) data are mean ±SEM (n = 21 antibiotic treated, 20 untreated) with multiple unpaired t tests. For (E) n = 6 pre- and 6-post antibiotic treated, with multiple unpaired t tests. *p < 0.05, **p < 0.01, *** p < 0.001.