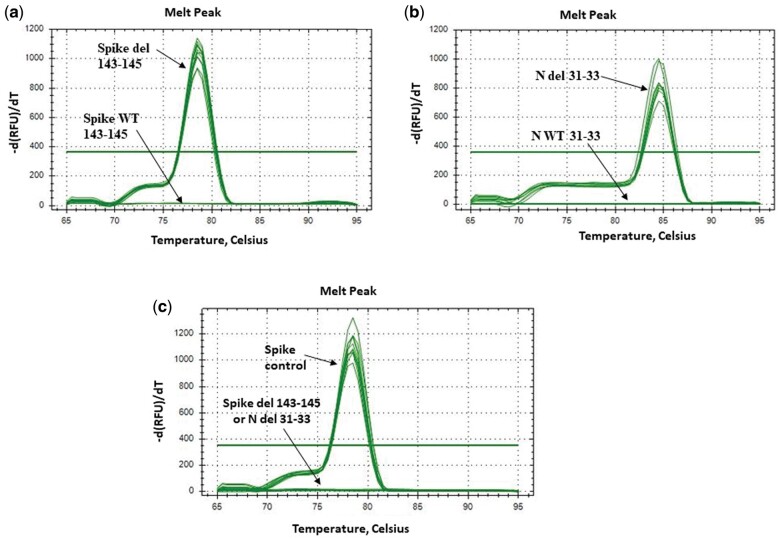
Figure 3.
The melting curves for the products amplified with the SYBR Green-based qPCR protocol in S-gene target failure samples using the primers: (a) Spike del 143-145; (b) N del 31-33. The melting curves in Delta samples using the primers: (c) Spike control and Spike del 143-145 or N del 31-33 reveal specific melt peak for each primer set.

