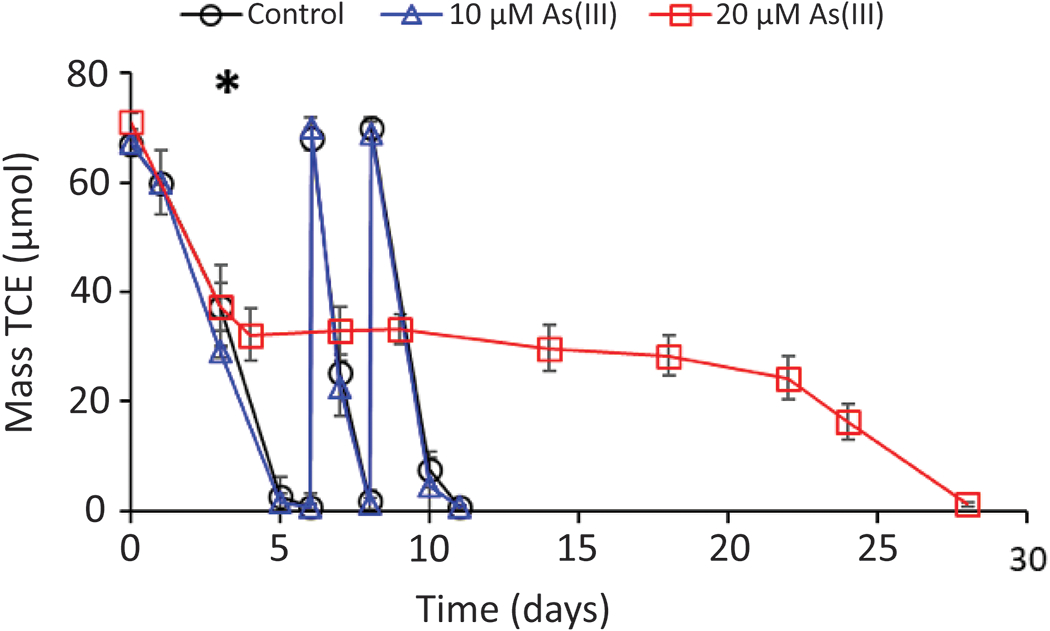
Figure 3.

TCE consumption by Dhc195/DvH reported as mass TCE (μmol) versus time (days) over 28 days with 10 μM As(III), 20 μM As(III), and a positive control. Mass reported is the sum of aqueous and gaseous masses. The asterisk denotes the time that As(III) was added to the cultures. Error bars represent one standard deviation of experimental triplicates. No change in the valence state of arsenic was observed in any cultures (Figure S3).
