
Fig. 7.
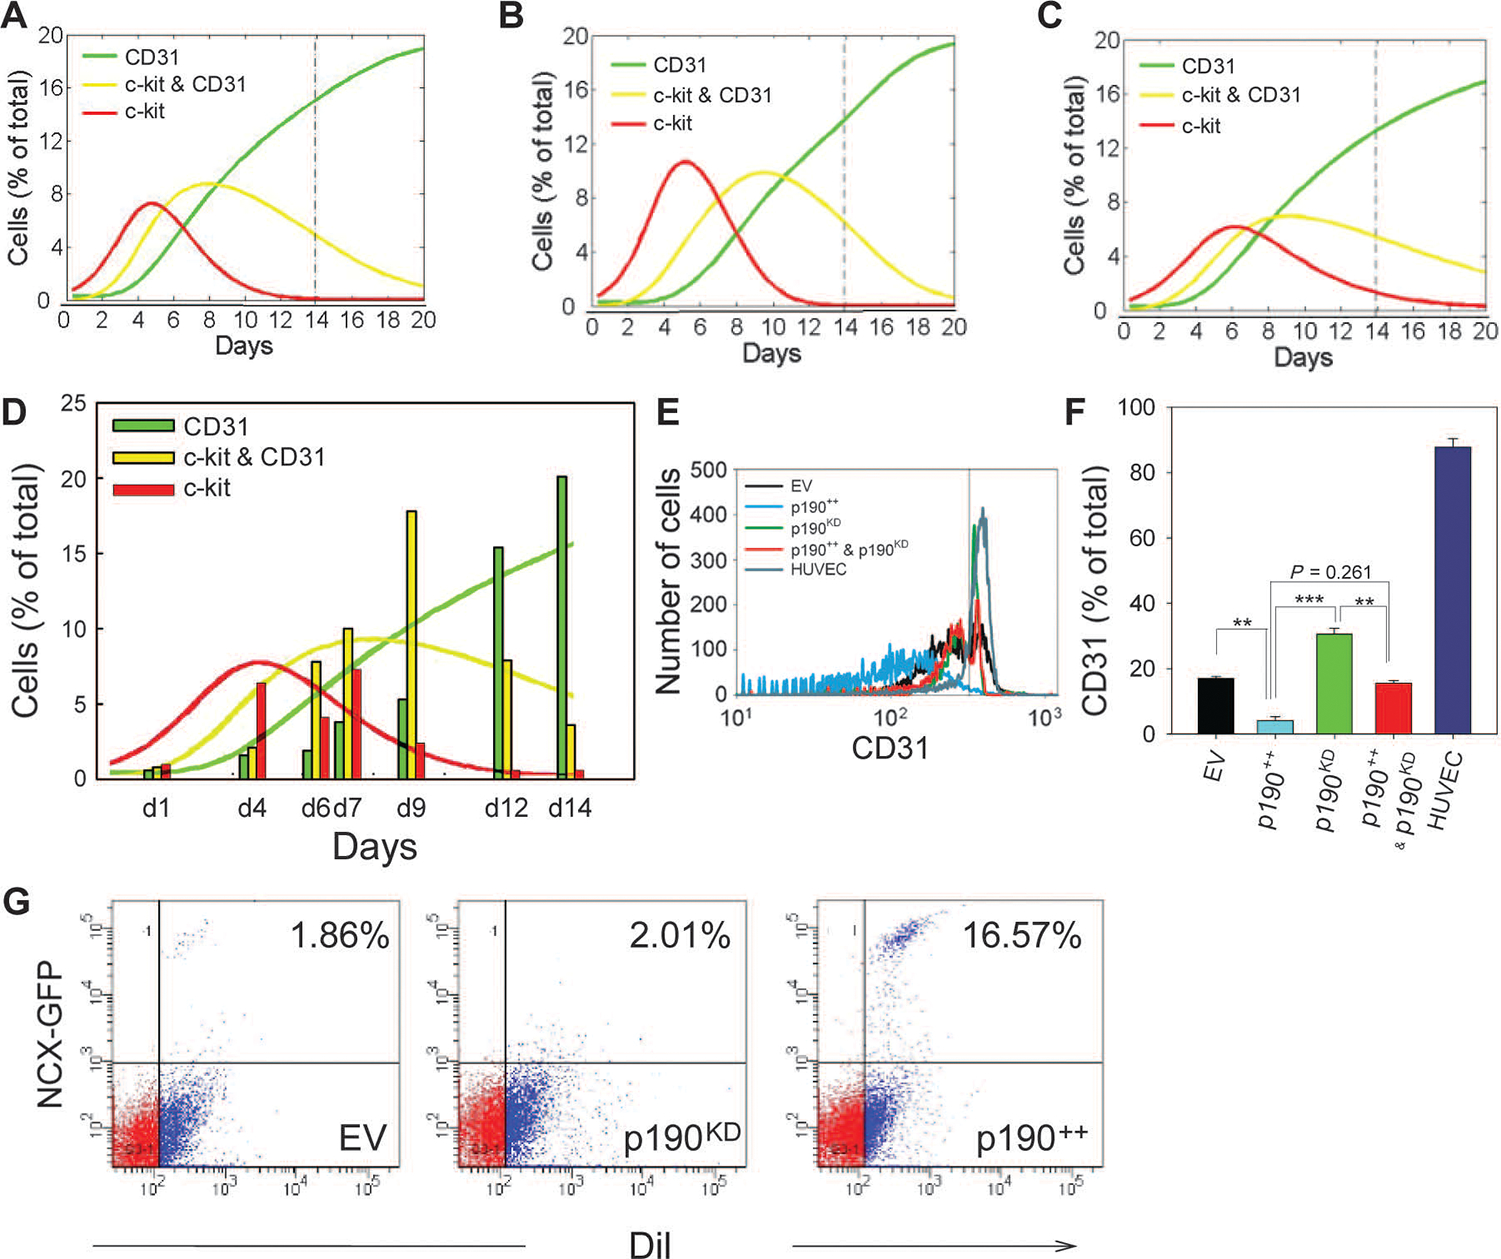
p190RhoGAP regulates MRS-induced CDC proliferation and endothelial differentiation. (A to D)Computational model and experimental analysis of CDC proliferation and differentiation. Representative simulation results showing effects of enhanced proliferation and differentiation (see also fig. S7), with increased proliferation rates for c-kit /CD31 and c-kit+/CD31+ cells (A), increased differentiation rates for c-kit+/CD31− and c-kit+/CD31+ cells (B), and increased rates for both proliferation and differentiation (C). Time course flow cytometry analysis of p190KD CDCs (vertical bars) (D). Overlaid solid lines show predictions of computational model calculated in (C). (E) Flow cytometric analysis of CD31 abundance of CDCs transduced with empty SV40 plasmid (EV, black), p190RhoGAP overexpression vector (p190++, blue), p190KD CDCs (green), p190++CDCs rescued with p190RhoGAP shRNA (p190++ and p190KD, red), and human umbilical cord endothelial cells (HUVEC) (cyan). (F) Quantification of percentage of CD31+ cells in (E). (G) Flow cytometric analysis of DiI-labeled CDC-lv-NCX-GFP cells transduced with empty SV40 expression vector (EV), p190RhoGAP overexpression vector (p190++), and p190RhoGAP shRNA (p190KD) in coculture with NRVMs for 10 days on MRS (n = 2 samples). Gates were created with negative control samples for DiI− and wild-type CDCs. In all panels: *P < 0.05; **P < 0.01. Error bars, SEM.