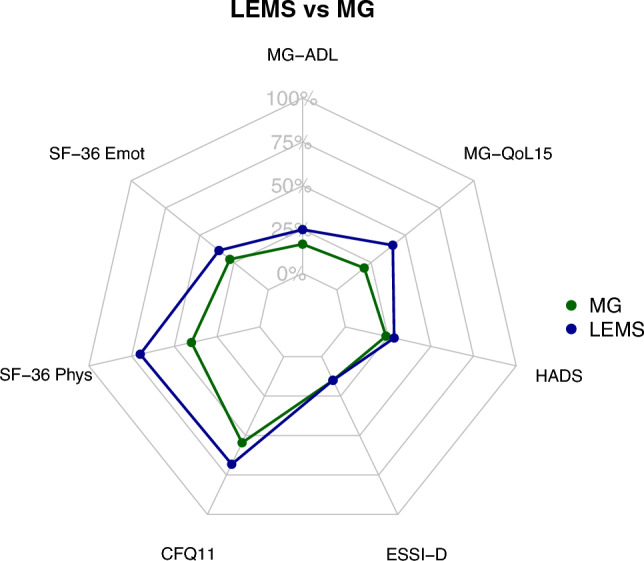
Fig. 4.

Net diagrams comparing LEMS (blue) and MG (green) patients integrating the medians of the Myasthenia gravis Activities of Daily Living Score (MG-ADL), the Myasthenia gravis Quality of life Score (MG-QoL15), the Hospital Anxiety and Depression Scale (HADS), the ENRICHD Social Support Inventory (ESSI-D), the Chalder Fatigue Scale (CFQ11) and the Physical Functioning (SF-36 Phys) and Emotional wellbeing (SF-36 Emot) domain of the Short Form 36 (SF-36) comparing MG (green) and LEMS (blue) patients. The further out the lines are in the net, the higher and worse the single score value: LEMS patients do have a higher burden of disease, composed of high single score values, compared to MG patients
