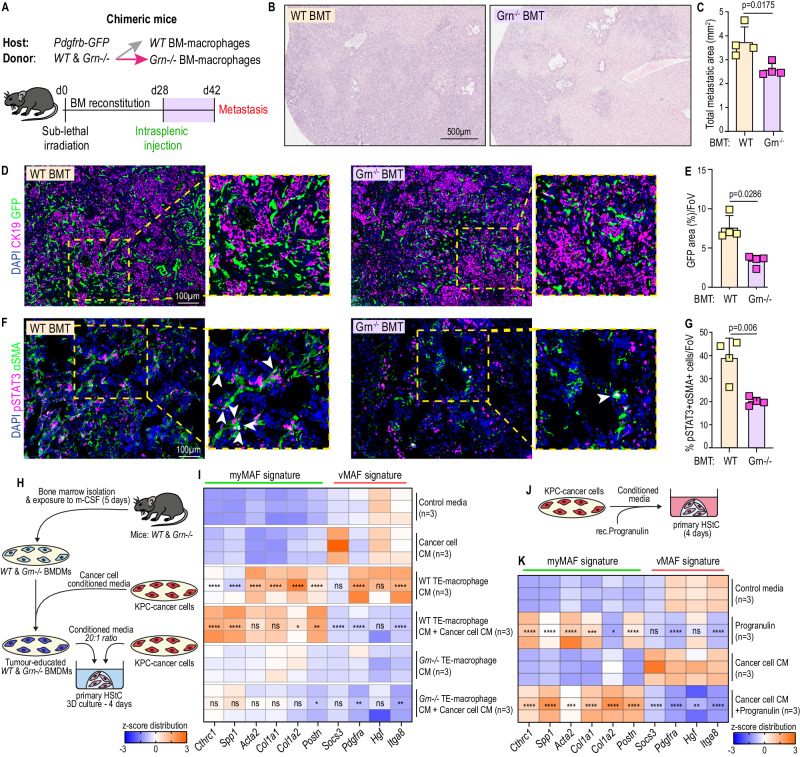
Fig. 4. Co-stimulation of progranulin and cancer-cell derived factors promote myMAF activation.
A Generation of chimeric Pdgfrb-GFP mice with either WT, or Grn−/−, bone marrow (BM) reconstitution. WT and Grn−/− BM transplanted mice were implanted with KPC cells and terminated after 14 days. Representative H&E staining (B) and quantification of the average sum of metastatic area per group (C). Scale bar, 500 µm. n = 4 mice per group. Error bars, SD. P value, two-tailed unpaired t-test. Representative immunofluorescence image (D) and quantification of MAFs (GFP+) among metastatic tumours (CK19+) of WT and Grn−/− BM Pdgfrb-GFP mice (E). Scale bar, 100 µm. n = 4 mice per group. Data is presented as mean GFP percentage area. Error bars, SD. P value, two-tailed Mann–Whitney test. Representative immunofluorescence image (F) and quantification (G) of JAK/STAT active (pSTAT3+) myMAFs (αSMA+). Arrowheads, double positive cells. Scale bar, 100 µm. n = 4 mice per group. Data is presented as average percentage of pSTAT3+αSMA+ cells, among αSMA+ cells. Error bars, SD. P value, two-tailed unpaired t-test. H Schematic of experimental design. Bone marrow-derived macrophages were generated from WT and Grn−/− mice and educated with cancer cell CM for 24 h. Primary HStCs were exposed to conditioned media from tumour educated macrophages and cancer cells, alone or in combination, for 4 days. I Heatmap of selected myMAF and vMAF gene signature expression in primary HStCs stimulated as outlined in H. N = 3 independent experiments. P value, one-way ANOVA with Tukey’s multiple comparisons. Significance shown depict: WT TE-Macrophage CM vs Control media; WT TE-Macrophage CM+ Tumour CM vs WT TE-Macrophage CM; Grn−/− TE-Macrophage CM+ Tumour CM vs Grn−/− TE-Macrophage CM. TE Tumour educated. J Schematic of experimental design. Primary HStCs were exposed to cancer cell CM supplemented with recombinant progranulin for 4 days. K Heatmap of selected myMAF and vMAF gene signature expression in primary HStCs stimulated as outlined in J. n = 3 independent experiments. P value, one-way ANOVA with Tukey’s multiple comparisons. Significance shown, Progranulin vs Control media; Cancer cell CM+ Progranulin vs Cancer cell CM. Source data and exact p values are provided as a Source Data file.

