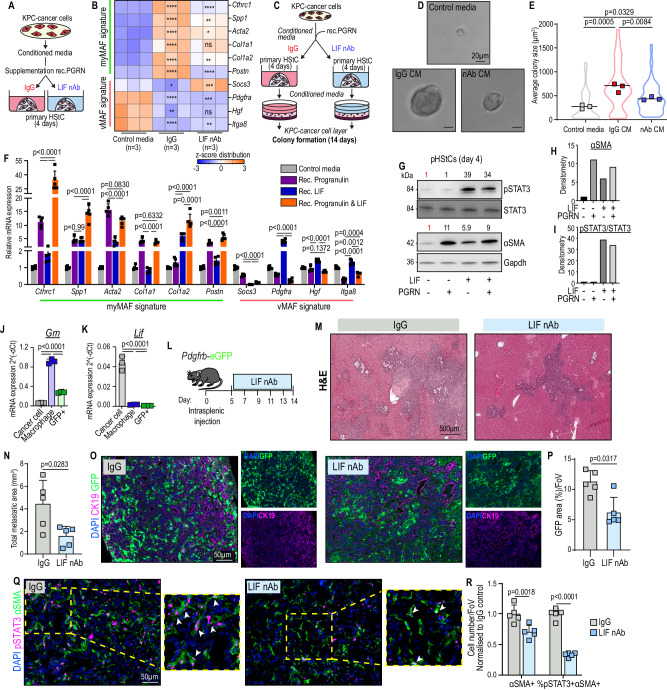
Fig. 5. Neutralisation of cancer-cell derived LIF represses the activation of pSTAT3+myMAFs and inhibits metastatic outgrowth.
Schematic of experiment (A) and qPCR (B) of vMAF and myMAF genes. Data is presented as heatmap of z-scores. n = 3 independent experiments. P value, one-way ANOVA with Tukey’s multiple comparisons. Significance shown: IgG vs Control media; LIF-nAb vs IgG. Schematic of experimental design (C) and representative images (D) of colony formation. Scale bar: 20 µm. E Quantification of average colony size presented as average from n = 3 independent biological experiments. P value, one-way ANOVA with Tukey’s multiple comparisons. F qPCR of myMAF and vMAF genes in primary HStCs stimulated with Progranulin, LIF, or both. Data represents average fold change. n = 5 independent experiments. Error bars, SD. P value, one-way ANOVA with Tukey’s multiple comparisons. G–I Immunoblotting (I) of primary HStCs stimulated with Progranulin, LIF, or both, and densitometric analysis of (H) αSMA and (I) pSTAT3/STAT3 activity relative to Gapdh. Experiment was repeated three times with similar results. qPCR of (J) Grn and (K) Lif mRNA expression in Cancer cells, Macrophages, and MAFs isolated from metastasis bearing Pdgfrb-GFP mice. n = 3 independent mice. Error bars, SD. P value, one-way ANOVA with Tukey’s multiple comparisons. L Schematic of experimental design to treat metastasis-bearing Pdgfrb-GFP mice with IgG or LIF-nAb. Representative H&E staining (M) and quantification (N) of average metastatic area from IgG and LIF-nAb treated mice. Scale bar: 500 µm. n = 5 mice per group. Error bars, SD. P value, two-tailed unpaired t-test. Representative immunofluorescence image (O) and quantification (P) of MAFs (GFP+) among metastatic tumours (CK19+) of IgG and LIF-nAb treated mice. Scale bar, 50 µm. n = 5 mice per group. Data represents average percentage area of GFP. Error bars, SD. P value, two-tailed Mann–Whitney test. Representative immunofluorescence image (Q) and quantification (R) of αSMA+, and percentage of pSTAT3+αSMA+ cells, presented as average fold change relative to control, in IgG and LIF-nAb treated mice. Scale bar: 50 µm. Arrowheads indicate double positive cells. n = 5 mice per group. Error bars, SD. P value, two-way ANOVA with Tukey’s multiple comparisons. Source data and exact p values are provided as a Source Data file.

