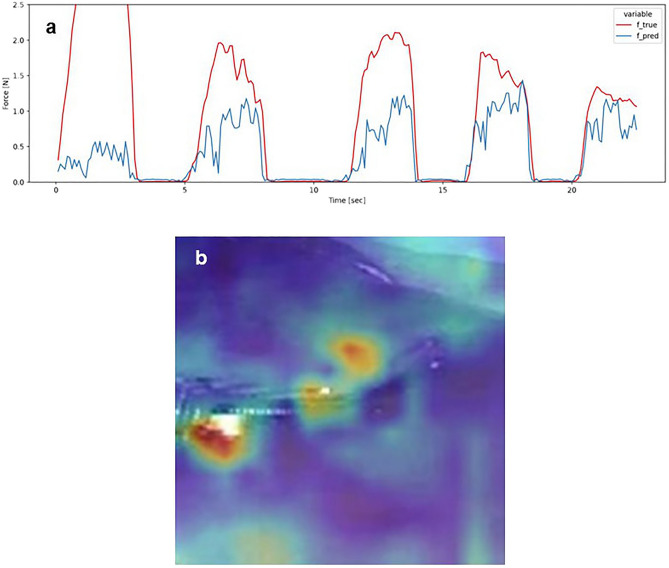
Figure 3.
Forceps pressure estimation data in the cropping model. (a) Waveform of force estimation over time. ( ) indicates the actual force generation and (
 ) indicates the force generation estimated by the model. Both the timing and magnitude of force generation are more consistent than those in the non-cropping model. (b) The saliency map shows that the ROIs in the estimated model are distributed at the tips of the forceps. ROI Region of interest.

