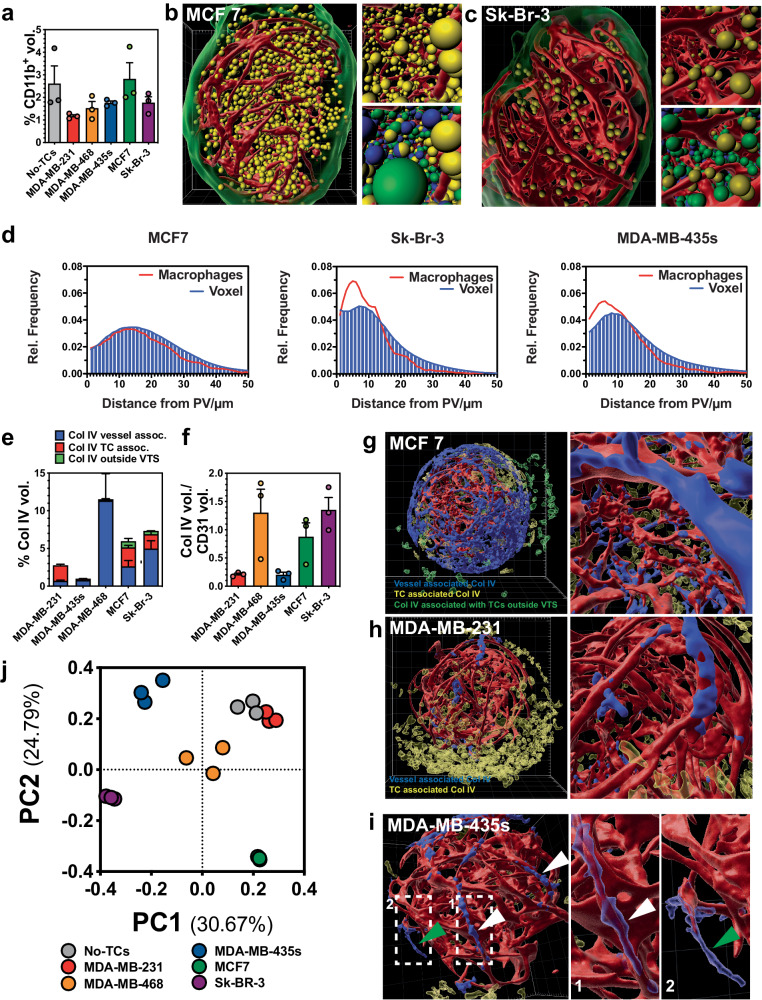
Fig. 4. Effect of different tumor cell lines on macrophage incorporation and ECM distribution.
a Relative CD11b+ volumes of VTSs generated only from fibroblasts, ECs, and THP-1s (w/o tumor cells), or under the addition of five different tumor cell lines. b Distribution of CD11b+ cells within a VTS generated with MCF7 cells. CD11b+ cells are shown as yellow orbs of 10 µm diameter, red: CD31+ PVs, green: VTS surface. Top insert: detailed view, bottom insert: detailed view with TCs (green orbs), fibroblasts (blue orbs). c Distribution of CD11b+ cells within a VTS generated with Sk-Br-3 cells. CD11b+ cells are shown as yellow orbs of 10 µm diameter, red: CD31+ PVs, green: VTS surface. Top insert: detailed view, bottom insert: detailed view with TCs (green orbs), fibroblasts (blue orbs). d Macrophage distance vs. overall voxel distances from the nearest PV within VTSs. Error bars: not shown for clarity. e Relative Col IV+ volume in VTSs generated under the addition of different tumor cell lines. f Fraction of Col IV+ volume directly associated with the PVs over CD31+ PV volume. g Distribution of Col IV in an MCF7-based VTS. Red: CD31+ PV; Blue: Col IV directly associated with the PV; transparent yellow: Col IV in VTS not associated with the PV, transparent green: Col IV produced by cells outside, but attached to the VTS. h Distribution of Col IV in an MDA-MB-231-based VTS. Red: CD31+ PV; Blue: Col IV directly associated with the PV; transparent yellow: Col IV in VTS not associated with the PV. i Distribution of Col IV in an MDA-MB-435s-based VTS. Red: CD31+ PV; Blue: Col IV directly associated with the PV; transparent yellow: Col IV in VTS not associated with the PV. White arrowheads: Col IV on the surface and surrounding PVs. Green arrowhead: empty Col IV sleeve. j Result from principal component analysis based on a 71-parameter descriptive data set. 3D grid spacing: 50 µm, error bars: ± SEM, n = 3 individual biological samples. Source data are provided as a Source Data file.

