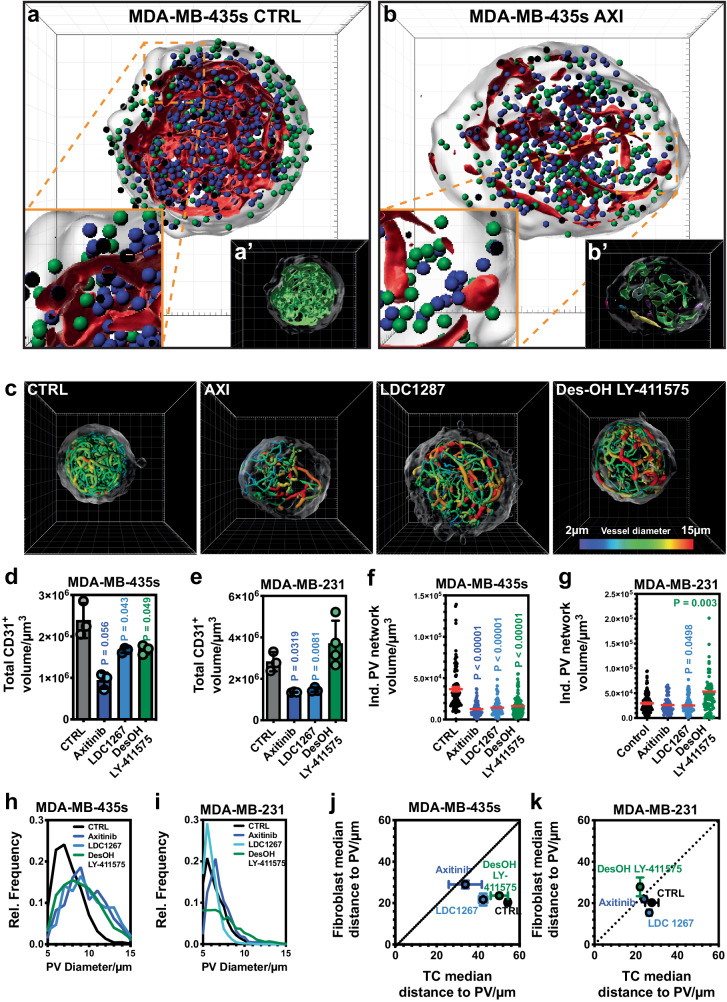
Fig. 5. Effect of anti-angiogenic agents on VTS composition and architecture.
a Architecture of untreated MDA-MB-435s-based VTSs. 3D-rendering of CD31+-PV surfaces (red) with TCs (green orbs), and fibroblasts (blue orbs). Frontal cut through VTS center in the xy-plane. a’ 3D-rendering of CD31+-PV surfaces in the same view, colored to represent the different structural objects. b Architecture of MDA-MB-435s-based VTSs after treatment with AXI. 3D-rendering of CD31+-PV surfaces (red) with TCs (green orbs), and fibroblasts (blue orbs). Frontal cut through VTS center in the xy-plane. b’ 3D-rendering of CD31+-PV surfaces in the same view, colored to represent the different structural objects. c Tracing of PV networks in MDA-MB-435s-based VTSs treated with three different anti-angiogenic agents. 3D-rendering of surfaces and segments colored according to diameter. d Absolute volumes of CD31+-cells within MDA-MB-435s-based VTSs after treatment. e Absolute volumes of CD31+-cells within MDA-MB-231-based VTSs after treatment. f Volumes of individual CD31+-PV networks identified by tracing in MDA-MB-435s-based VTSs after treatment. g Volumes of individual CD31+-PV networks identified by tracing in MDA-MB-231-based VTSs after treatment. h Distribution of PV-segment diameters in MDA-MB-435s-based VTSs after treatment. N = 3, error bars: not shown for clarity. i Distribution of PV-segment diameters in MDA-MB-231-based VTSs after treatment. Error bars: not shown for clarity. j Comparison of distances of TCs and fibroblasts in MDA-MB-435s-based VTSs from nearest PV after treatment. k Comparison of distances of TCs and fibroblasts in MDA-MB-231-based VTSs from nearest PV after treatment. 3D grid spacing: 50 µm, error bars: ± SEM, analyzed with unpaired two-tailed t-test against CTRL, n = 3 (except MDA-MB-231 DesOH LY-411575: n = 4) individual biological samples. Source data are provided as a Source Data file.

