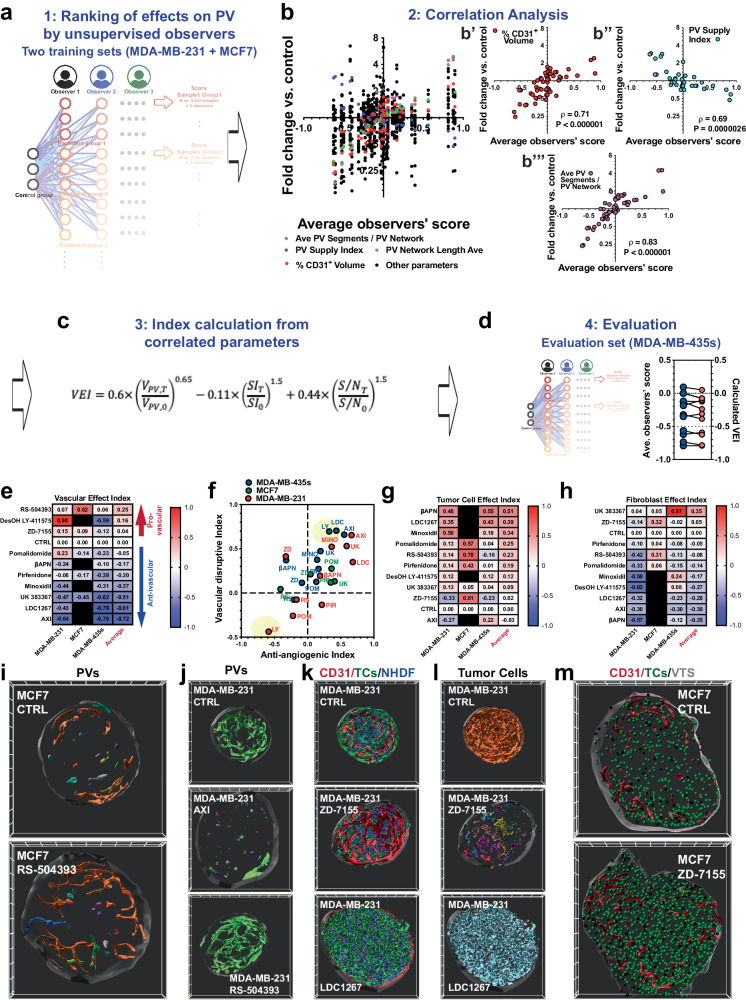
Fig. 6. Ranking of drug effects on VTS composition and architecture.
a Four untrained observers were tasked with rating the PV in all treated VTSs in the MCF7 and MDA-MB-231 sets against all adequate controls. The observer score (OS) represents the average of all ratings. b Correlation analysis of the OS for all treatments in the MCF7 and MDA-MB-231 sets versus numerical PV parameters. Significant correlation was found for changes in relative CD31+ volume, PV supply index, and in number of PV segments/PV network. Results from two-tailed correlation analysis with C.I. = 95%, and calculated Pearson correlation coefficient. c Equation with calculated factors for correlation of numerical PV parameters with OS. d Comparison of OS versus calculated vascular effect index (VEI) in the MDA-MB-435s set used for evaluation. e Calculated VEIs of all tested drugs in the MCF7, MDA-MB-231, and MDA-MB-435s sets. f Anti-angiogenic versus the vascular disruptive effect of the tested drugs in the MCF7, MDA-MB-231, and MDA-MB-435s sets. Only the average of three samples is shown for clarity. g Calculated tumor cell effect index of all tested drugs in the MCF7, MDA-MB-231, and MDA-MB-435s sets. h Calculated fibroblast effect index of all tested drugs in the MCF7, MDA-MB-231, and MDA-MB-435s sets. i Architecture of PV in MCF7 VTSs in control and RS-504393-treatment groups. 3D-rendering of CD31+-PV surfaces pseudo-colored to represent the different structural objects. Frontal cut through VTS center in the xy-plane. j Architecture of PV in MDA-MB-231 VTSs in control and treatment groups (AXI, RS-504393). 3D-rendering of CD31+-PV surfaces pseudo-colored to represent the different structural objects. Frontal cut through VTS center in the xy-plane. k Composition of MDA-MB-231 VTSs, control, ZD-7155, and LDC 1267 treatment groups. 3D-rendering of CD31+-PV surfaces (red), tumor cells (green), and fibroblasts (blue). Frontal cut through VTS center in the xy-plane, 50 µm depth. l The same frontal cut through treated MDA-MB-231 VTSs as in (k), but 3D-rendering of tumor cell clusters are pseudo-colored to represent different connected objects. m Frontal cut through MCF7 VTSs in the control group and after treatment with ZD-7155. 3D-rendering of CD31+-PV surfaces (red), and individual tumor cells (green) represented as 10 µm orbs. Frontal cut through VTS center in the xy-plane, 50 µm depth. 3D grid spacing: 50 µm, error bars: ± SEM, n = 3 individual biological samples. Source data are provided as a Source Data file.

