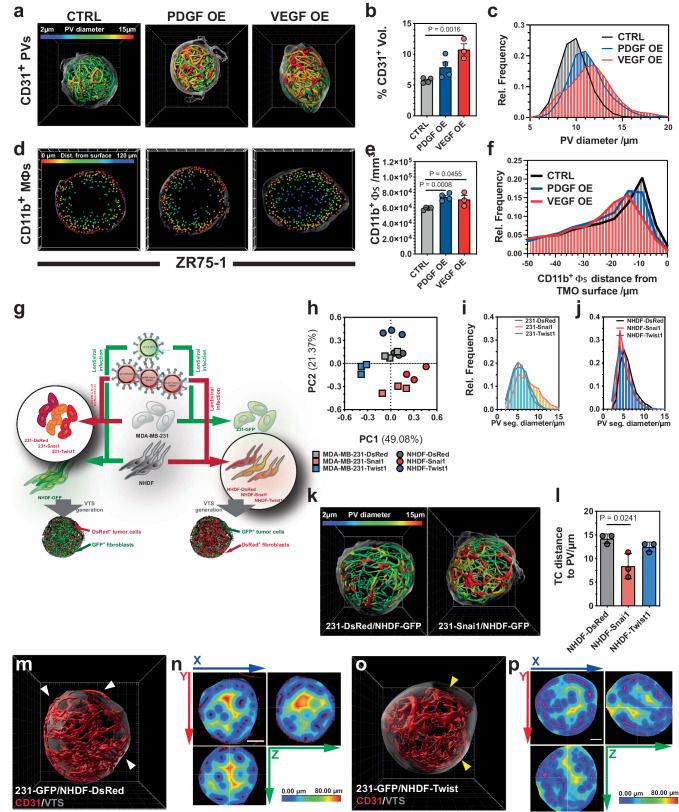
Fig. 8. Genetic manipulation of defined cellular components.
a Traced PVs in VTSs generated from CTRL, VEGF-A, or PDGF-B OE ZR75-1 tumor cells. PV segments are color-coded according to mean diameter. b Percentage of CD31+-volume of total VTS volume in ZR75-1 VTSs. CTRL and PDGF-OE: n = 4; VEGF-OE: n = 3. c Distribution of PV-segment mean diameters in ZR75-1 VTSs. CTRL and PDGF-OE: n = 4; VEGF-OE: n = 3. d Position of CD11b+-macrophages in CTRL, VEGF-A, or PDGF-B OE ZR75-1 VTSs. Frontal cut through VTS center in the xy-plane, 50 µm depth. e Density of CD11b+-macrophages in ZR75-1 VTSs. CTRL and PDGF-OE: n = 4; VEGF-OE: n = 3. f Distribution of minimal distance of CD11b+-macrophages to the VTS surface in ZR75-1 VTSs. CTRL and PDGF-OE: n = 4; VEGF-OE: n = 3. g Schematic view of the generation of Snai1/Twist1 OE MDA-MB-231 tumor cells and fibroblasts to produce genetically modified VTSs. h Principal component analysis of effects from Snai1 or Twist1 OE in MDA-MB-231 tumor cells or NHDFs. Analysis based on a 49-parameter descriptive data set. i Distribution of PV-segment diameters within VTSs generated from CTRL, Snai1, or Twist1 OE MDA-MB-231 cells. Average of 3 VTSs/group. j Distribution of PV-segment diameters within VTSs generated from CTRL, Snai1, or Twist1 OE NHDF. Average of 3 VTSs/group. k Traced PVs in VTSs generated from CTRL or Snai1 OE MDA-MB-231. Color-coded according to PV mean diameter. l Average distance of tumor cells to nearest pseudovessel in VTSs generated from CTRL, Snai1, or Twist1 OE NHDF. m PV networks (red) within a VTS (surface: transparent gray) generated from MDA-MB-231-GFP and NHDF-DsRed. Some PVs are located close to or on the surface of the VTS (white arrowheads). n Heatmap, displaying distances from the nearest PV (red) in a VTS generated from MDA-MB-231-GFP and NHDF-DsRed. The VTS’s center is almost void of PVs. o PV networks (red) within a VTS (surface: transparent gray) generated from MDA-MB-231-GFP and NHDF-Twist1. The outermost layer of PVs is substantially retracted from the surface of the VTS (yellow arrowheads). p Heatmap, displaying distances from the nearest PV (red) in a VTS generated from MDA-MB-231-GFP and NHDF-Twist1. PVs also pervade the center of the VTS. 3D grid spacing: 50 µm, scale bars: 100 µm error bars: ± SEM, analyzed with unpaired two-tailed t-test, n = 3, individual biological samples if not otherwise stated. Source data are provided as a Source Data file. OE overexpression.

