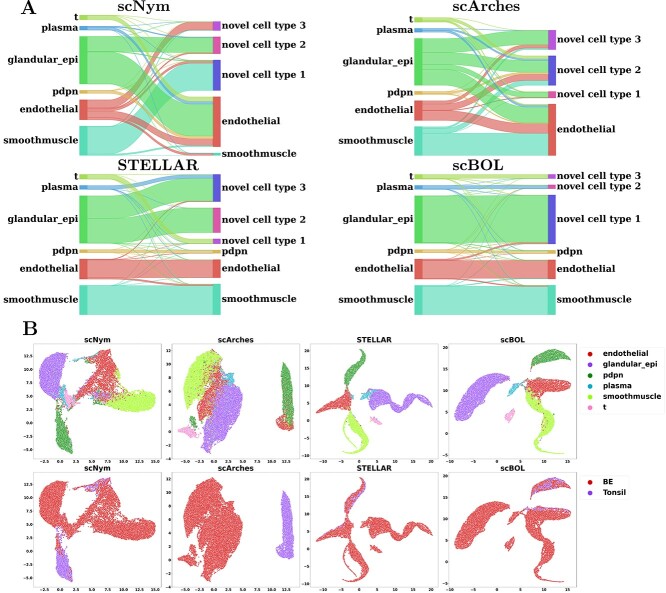
Figure 8.
Inter-data experiments on Tonsil-BE spatial transcriptomics data, where using Tonsil as reference dataset and BE as target dataset. A. Mapping relationship among prediction results of scBOL and other three methods via Sankey plots. B. Visualization plots via UMAP for Tonsil-BE experiments calculated using the latent representations of scBOL and seven other methods colored by cell types.

