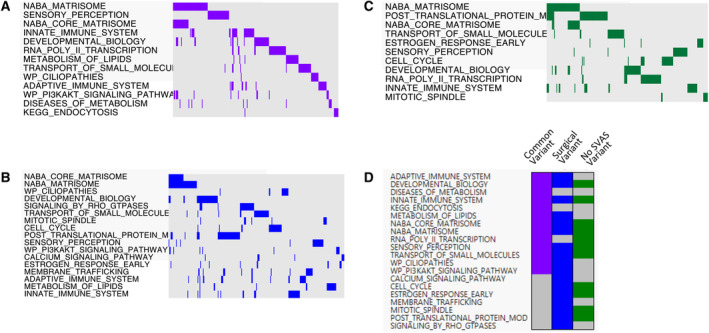
Figure 2. Depiction of SVAS modifier pathways identified through gene set enrichment and association testing.

A, Thirteen aggregated common variant pathways. The most enriched pathways are presented in order of statistical significance. The colors represent the presence (purple) and absence (gray) of genes in that pathway (genes are represented by columns across the top of the image). B, Seventeen aggregated surgical SVAS variant pathways in blue. C, Eleven aggregated no SVAS variant pathways in dark green. D, Overlapping of 20 pathways in the 3 sets of pathway analyses. See Figures S4, S5, and S6 for the full (preaggregation) pathways. SVAS indicates supravalvar aortic stenosis.
