
Figure 5. Correlations between post‐PCI cTnI level and PCAT attenuation or IMR‐related variables.
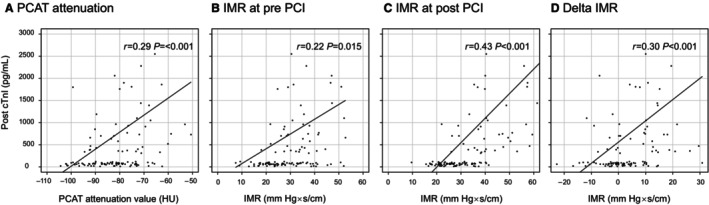
A, PCAT attenuation. A significant correlation was found between PCAT attenuation and post‐PCI cTnI (r=0.29, P<0.001). B, Pre‐PCI IMR. A weak correlation was found between pre‐PCI IMR and post‐PCI cTnI (r=0.22, P=0.015). C, Post‐PCI IMR. A significant correlation was found between post‐PCI IMR and post‐PCI cTnI (r=0.43, P<0.001). D, Δ IMR. A significant correlation was found between Δ IMR and post‐PCI cTnI (r=0.30, P<0.001). cTnT indicates cardiac troponin I; IMR, index of microvascular resistance; PCAT, pericoronary adipose tissue; and PCI, percutaneous coronary intervention.