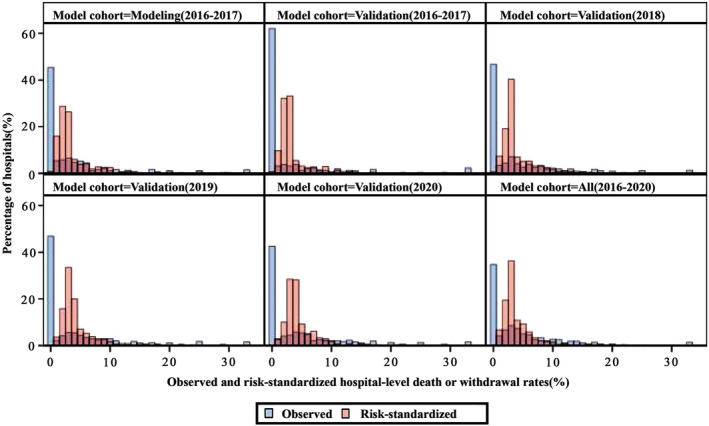
Figure 2. Distributions of observed and risk‐standardized hospital‐level death or withdrawal rates in different study cohorts.

The figure shows the hospital‐level observed (blue bins) and risk‐standardized (red bins) death or withdrawal rates in different year cohorts and the entire cohort between 2016 and 2020.
