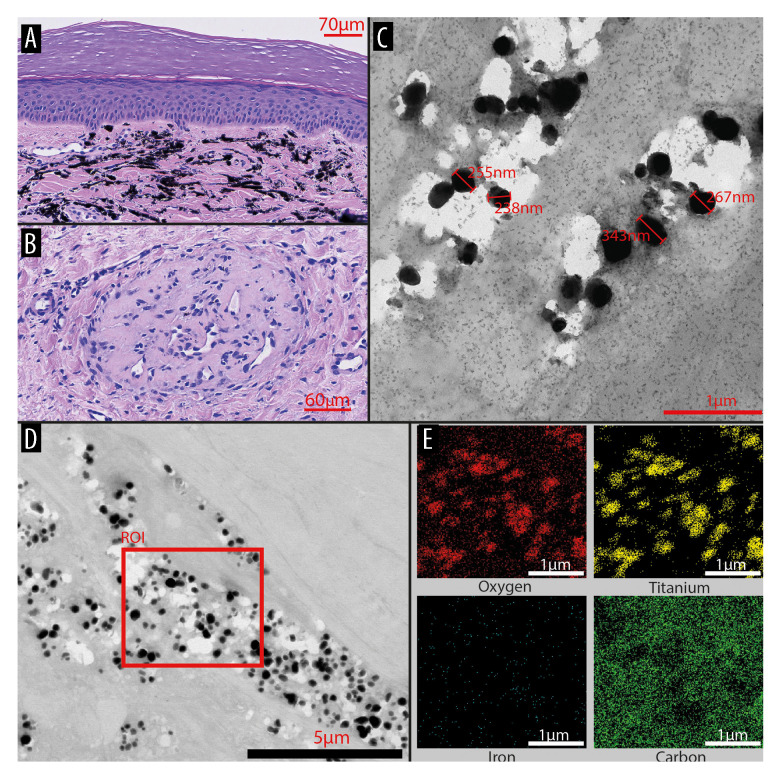
Figure 3.
(A) Histology of the reactive tattoo following the first MRI adverse event, scale bar 70 μm. (B) The thrombosed vessel showing signs of angiogenesis, taken from a biopsy after the third MRI session, scale bar 60 μm. (C) TEM image of the tattoo pigment particles sized 243–343 nm, scale bar 1 μm. (D) STEM image displaying clusters of pigment, scale bar 5 μm. The red rectangle highlights the selected region of interest (ROI) for EDX analysis. (E) Elements such as oxygen, titanium, iron, and carbon are identified within the region of interest, scale bar 1 μm.

