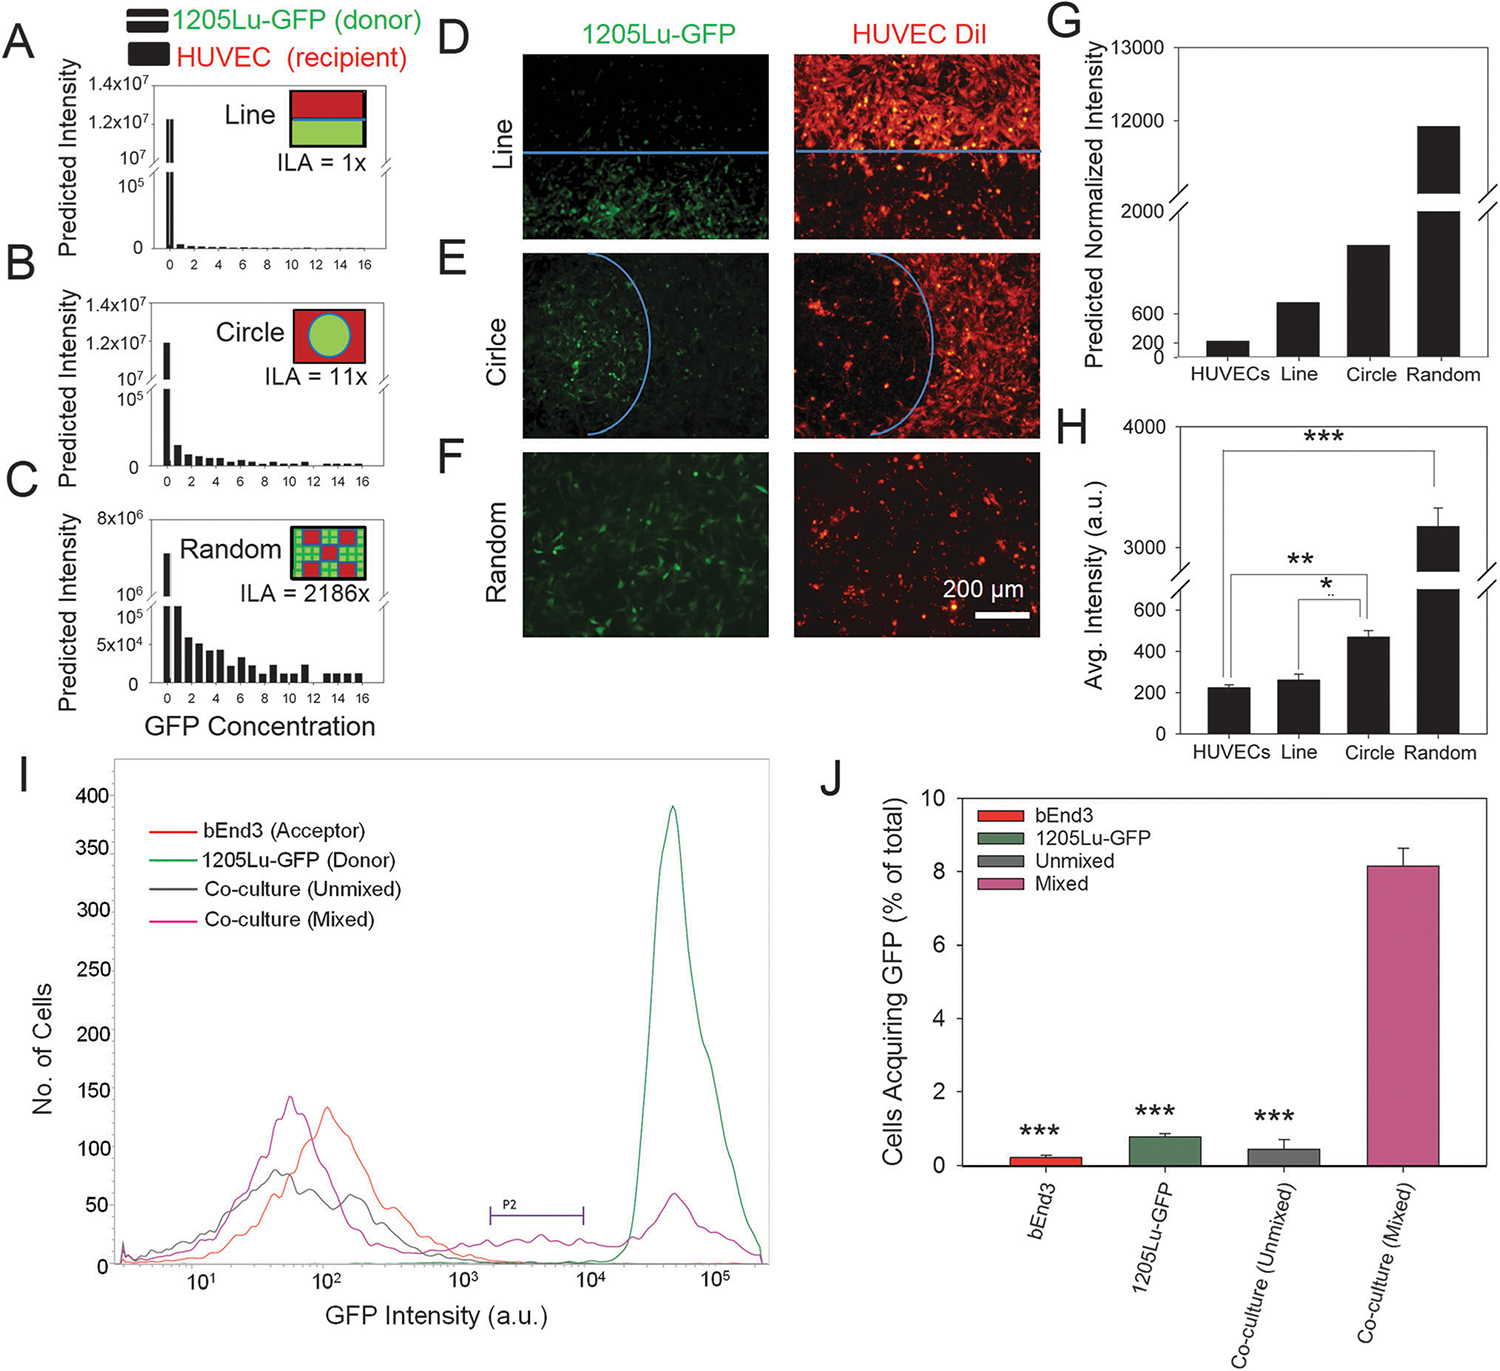
Fig. 2.

Cytosolic intercellular protein transfer occurs via direct cell–cell contact. The computational model showing distribution of GFP concentration in recipient HUVECs with the ILA (heterotypic interactive length per unit area) being 1× (A), 11× (B), and 2186× (C); striped bars in A–C refer to donor GFP +ve cells, while black bars refer to GFP levels in recipient cells; schematic showing the design of computational model and experimental design of patterning DiI-HUVECs (red) and 1205Lu-GFP cells (green) in a line, circle, or randomly to control the ILA (shown in solid blue line) shown in the inset of A–C. Microfabricated stencil based patterning of DiI-labeled HUVECs and 1205Lu-GFP cells with ILA topology being a line (D), circle (E), and randomly distributed cells (F); in A–F the initial seeded area for each cell type was kept equal, while changing the ILA. Computationally calculated GFP intensity of HUVECs at an interface with 1205Lu-GFP cells in the form of a line, circle, or in a random mixture (G); intensity is normalized to the initial experimental value of unlabeled HUVECs. Average GFP intensity of HUVECs after 7 days of co-culture with 1205Lu-GFP cells interacting with the HUVECs at an interface designed as a line, circle, or in a random mixture (H). (I and J) Cytosolic intercellular protein transfer requires cells to be physically in proximity; (H) representative flow cytometry profiles showing GFP expression in a population of bEnd3 endothelial cells and 1205Lu-GFP cells cultured separately (red, and green respectively), and of bEnd3 endothelial cells co-cultured with 1205Lu-GFP cells separated by a porous membrane but sharing the medium (gray), and co-cultured with direct cell–cell contacts (pink). P2 shows the subpopulation of bEnd3 endothelial cells that have received GFP from 1205Lu-GFP cells; (J) quantified analysis of percentage of cells in the region defined by P2 in I showing that physical contacts of cells is a requirement for intercellular cytosolic protein transfer. In all the above panels, *, n = 3 for independent co-culture experiments, P < 0.05, **, P < 0.01, ***, P < 0.001, between conditions connected with horizontal bars; error bars represent the standard error of mean (s.e.m).
