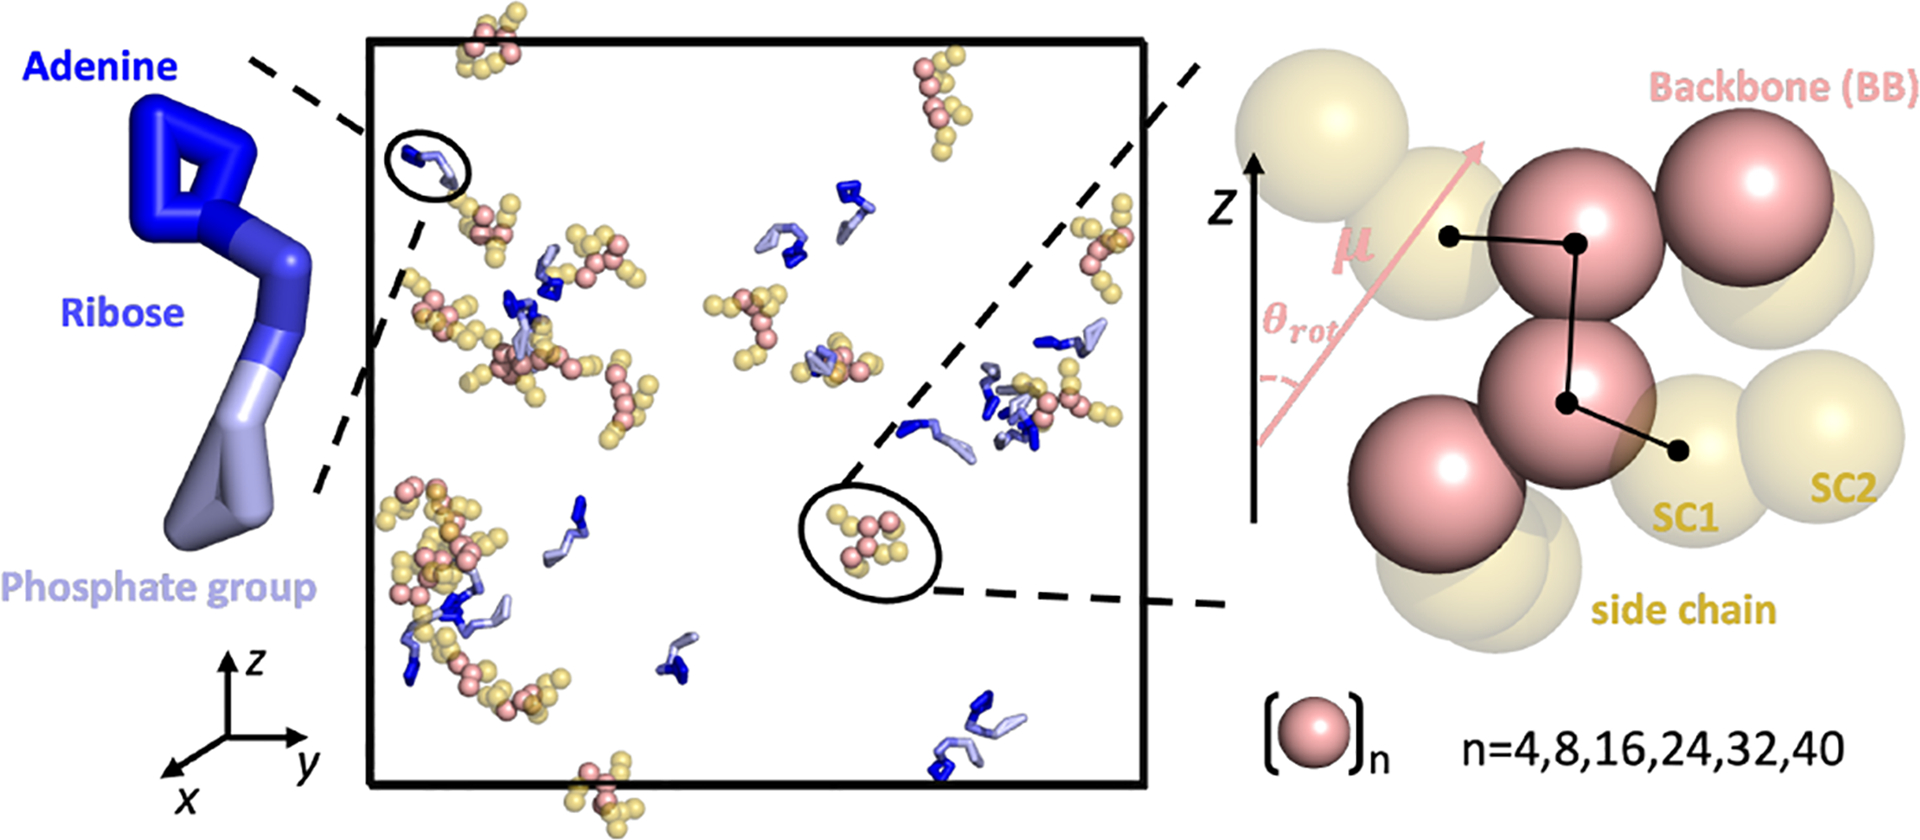
Fig. 1.

Schematic representation of key species utilized in this work. Although oligolysines of different lengths (n = 4,8,16,24,32,40) were examined, only the oligolysine with a length of 4 (K4) is depicted. For clarity, ions and water molecules are not shown. Oligolysines are represented as sphere with backbone colored in pink and side chains in yellow. ATPs are portrayed in stick form, segmented into three regions: adenine (blue), ribose (marine), and phosphate group (light blue). Rightly inseted is a zoom-in view of oligolysine with four consecutive lysine. Additionally illustrated are the orientation angle (θrot) formed between the dipole moment (μ) of a single oligolysine and the Z-axis of the simulation box and dihedral (SC1-BB-BB-SC1) formed between two adjacent residues.
