
Figure 5.
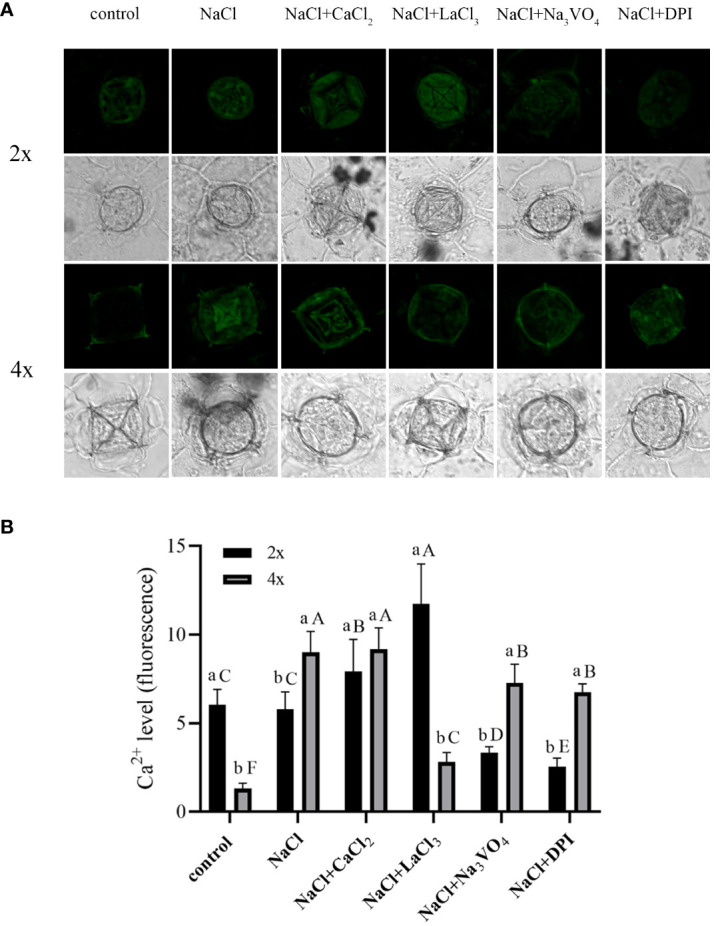
Changes in Ca2+ accumulation in salt glands of diploid (2x) and tetraploid (4x) Plumbago auriculata induced by NaCl stress and effects of LaCl3, Na3VO4, and DPI on Ca2+ accumulation under NaCl stress. (A) Representative graphs showing changes in Ca2+ accumulation in (top) diploid and (bottom) tetraploid salt glands before and after salt stress, as well as effects under LaCl3, Na3VO4, and DPI treatments. (B) Fluorescence intensity values from (A) measured by Image J software. For each treatment, nine salt glands from six individual plants were observed and quantified. In (B), different capital letters indicate significant differences (P < 0.05) between different treatments of the same ploidy level, whereas different lowercase letters indicate significant differences (P < 0.05) between ploidy levels of the same treatment.