
Figure 2.
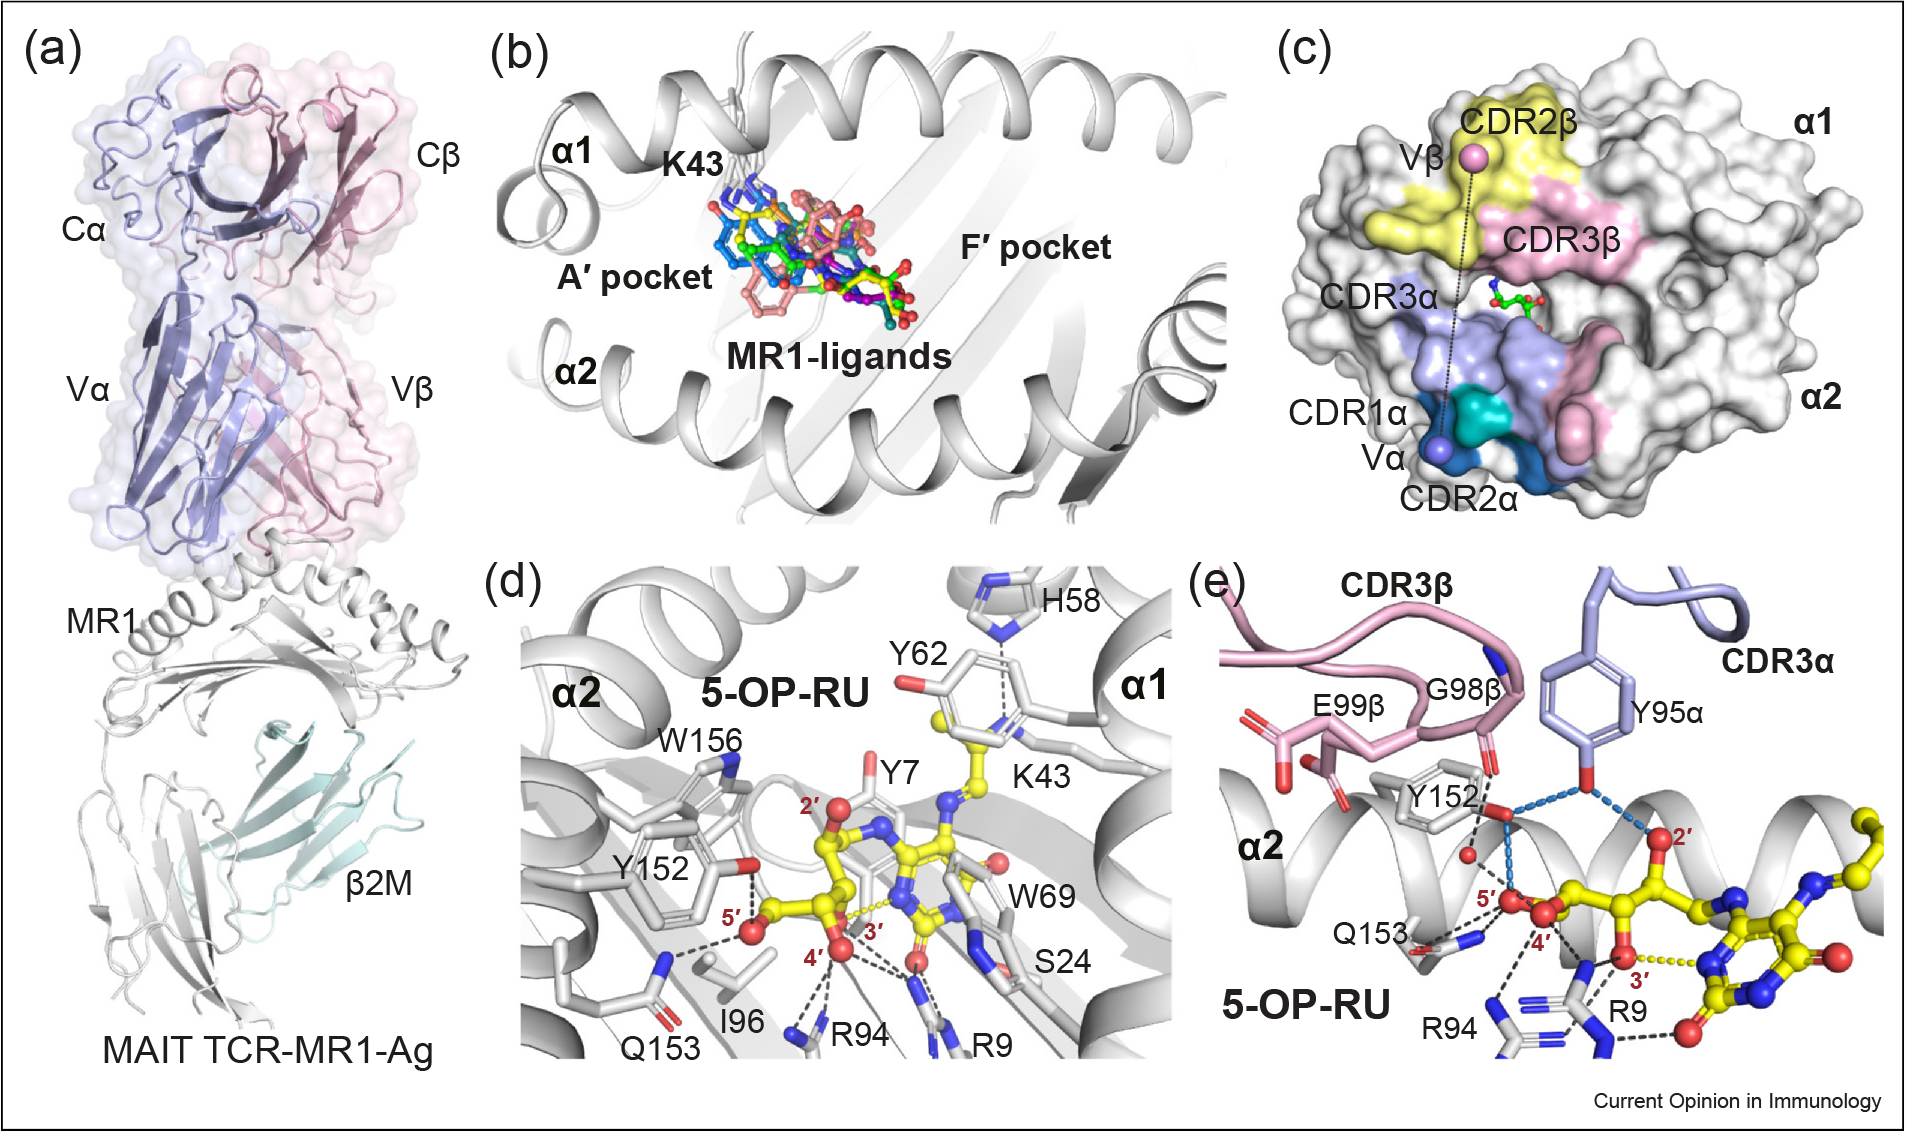
MAIT TCR recognition of MR1–pyrimidine-based metabolites. (a) Cartoon representation of the crystal structure of the ternary complex of the typical MAIT TRAV1–2+ A-F7 TCR–MR1–5-OP-RU (PDB: 6PUC). The constant (C) and variable (V) domains of the TCRα and TCRβ chains are shown as light-blue and light-pink surfaces, respectively. The MR1 and β2-microglobulin (β2M) molecules are shown as white and pale-cyan cartoons, respectively. (b) Surface representation of the MR1–Ag- binding A′ and F′ pockets that are formed between MR1 α1 and α2-helices. All recognized MR1 ligands (represented as colored sticks), to date, dock in the A′ pocket. (c) The footprint of the MAIT A-F7 TCR on the surface of MR1–5-OP-RU. The atomic footprint is colored according to the TCR segment making contact via its complementarity-determining region (CDR) loops colored as follows: CDR1α, teal; CDR2α, sky-blue; CDR3α, light-blue; frameworks of α-chain, dark-green; CDR1β, roseberry; CDR2β, pink; CDR3β, yellow-orange; and frameworks of β-chain, dark-gray. (d) Interactions of 5-OP-RU (yellow sticks) within the MR1-binding groove. MR1 α-helices and β-sheets are presented as white cartoon. (e) Interactions between the CDR3α and CDR3β loops of the MAIT A-F7 TCR and MR1–5-OP-RU. The relevant intramolecular H-bonds of 5-OP-RU are colored yellow. The MR1 pocket H-bonds are colored black, the TCR-related H-bonds are colored sky-blue. The CDR3α and CDR3β loop are colored as light-blue and light-pink, respectively. Waters are shown as red spheres. The structural illustrations in Figures 2, 3 and 4 were prepared using PyMOL Molecular Graphics System, Version 2.0, Schrodinger.