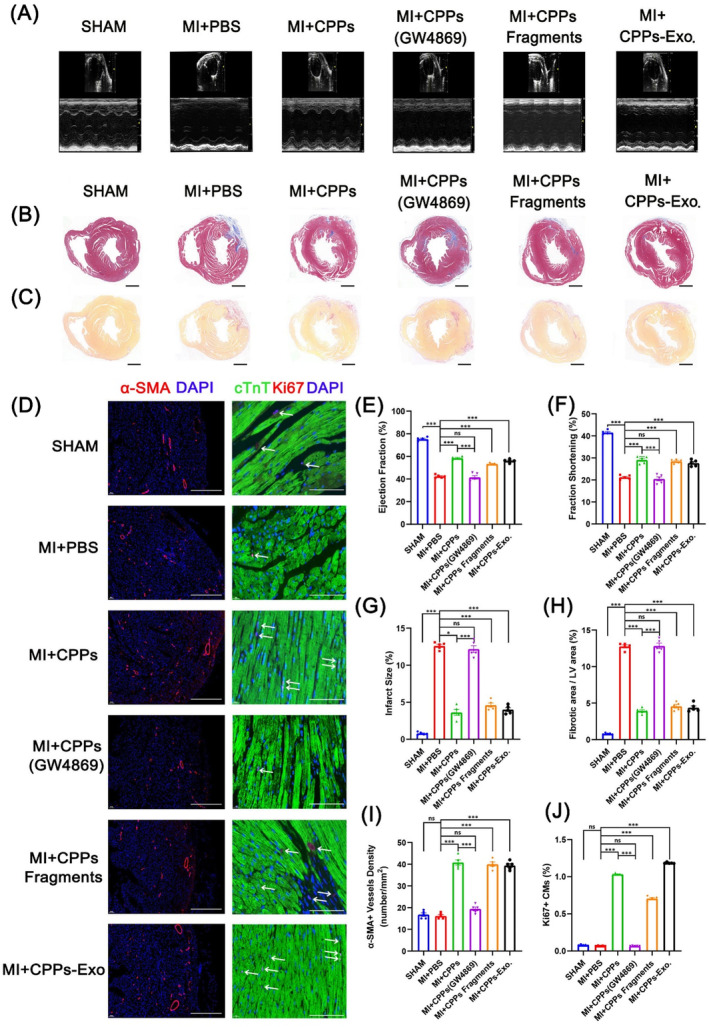
FIGURE 5.

Restoration of heart function after myocardial infarction (MI) by cardiopulmonary progenitor cells (CPPs) through CPPs exosomes (CPPs‐Exo). (A) Representative photographs of M‐mode echocardiography. Quantitative analysis of echocardiography is shown in (E,F). (B) Representative Masson's trichrome‐stained sections of murine hearts from six groups (SHAM, MI + PBS, MI + CPPs, MI + CPPs treated with GW4869, MI + CPPs fragments and MI + CPPs‐Exo, n = 5 per group). Scale bar, 1 mm. Quantitative analyses of the infarct size are shown in (G). (C) Representative images of Sirius red staining at 42 days after ligation of the hearts in 6 groups (SHAM, MI + PBS, MI + CPPs, MI + CPPs treated with GW4869, MI + CPPs fragments and MI + CPPs‐Exo, n = 5 per group). Scale bar, 1 mm. The percentage of fibrotic size is shown in (H). (D) Immunofluorescence detection of α‐SMA in sections of murine hearts from 6 groups (SHAM, MI + PBS, MI + CPPs, MI + CPPs treated by GW4869, MI + CPPs fragments and MI + CPPs‐Exo, n = 5 per group). Scale bar, 500 μm. Immunofluorescence detection of Ki67 and cTnT in heart sections of 6 groups (SHAM, MI + PBS, MI + CPPs, MI + CPPs treated with GW4869, MI + CPPs fragments and MI + CPPs‐Exo, n = 5 per group). Scale bar, 250 μm. (I) Determination of vessel density by quantifying the number of structures that expressed α‐SMA in an area of 1 mm2. (J) Determination of the Ki67+/cTnT+ cardiomyocyte ratio by quantifying the number of Ki67+/cTnT+ cells and cTnT+ cells. For (E–J), data are shown as the mean ± SEM; n = 5 biological replicates per group; *p < 0.05, ***p < 0.001, ns: not significant (t‐test).
