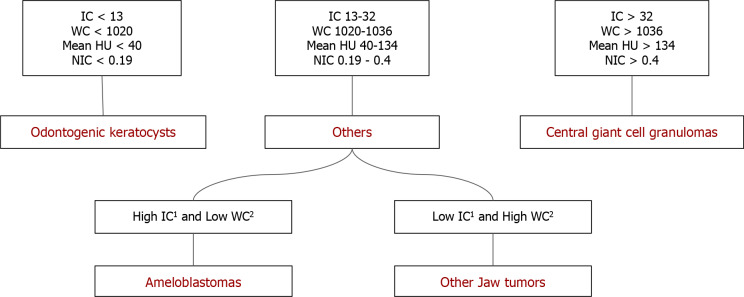
Figure 6.
Flowchart showing algorithmic differentiation of jaw tumors in the study population based on the quantitative analysis. Central giant cell granulomas had higher iodine concentration (IC), water concentration (WC), and normalized IC (NIC), odontogenic keratocysts with lower IC, WC, and NIC, ameloblastomas and other jaw tumor group showed values in between. Between the two, ameloblastomas had higher IC with lower WC while other jaw tumor group had lower IC with higher WC. 1Not significant; 2Marginally significant. WC: Water concentration; IC: Iodine concentration; NIC: Normalized iodine concentration.

