
FIGURE 1.
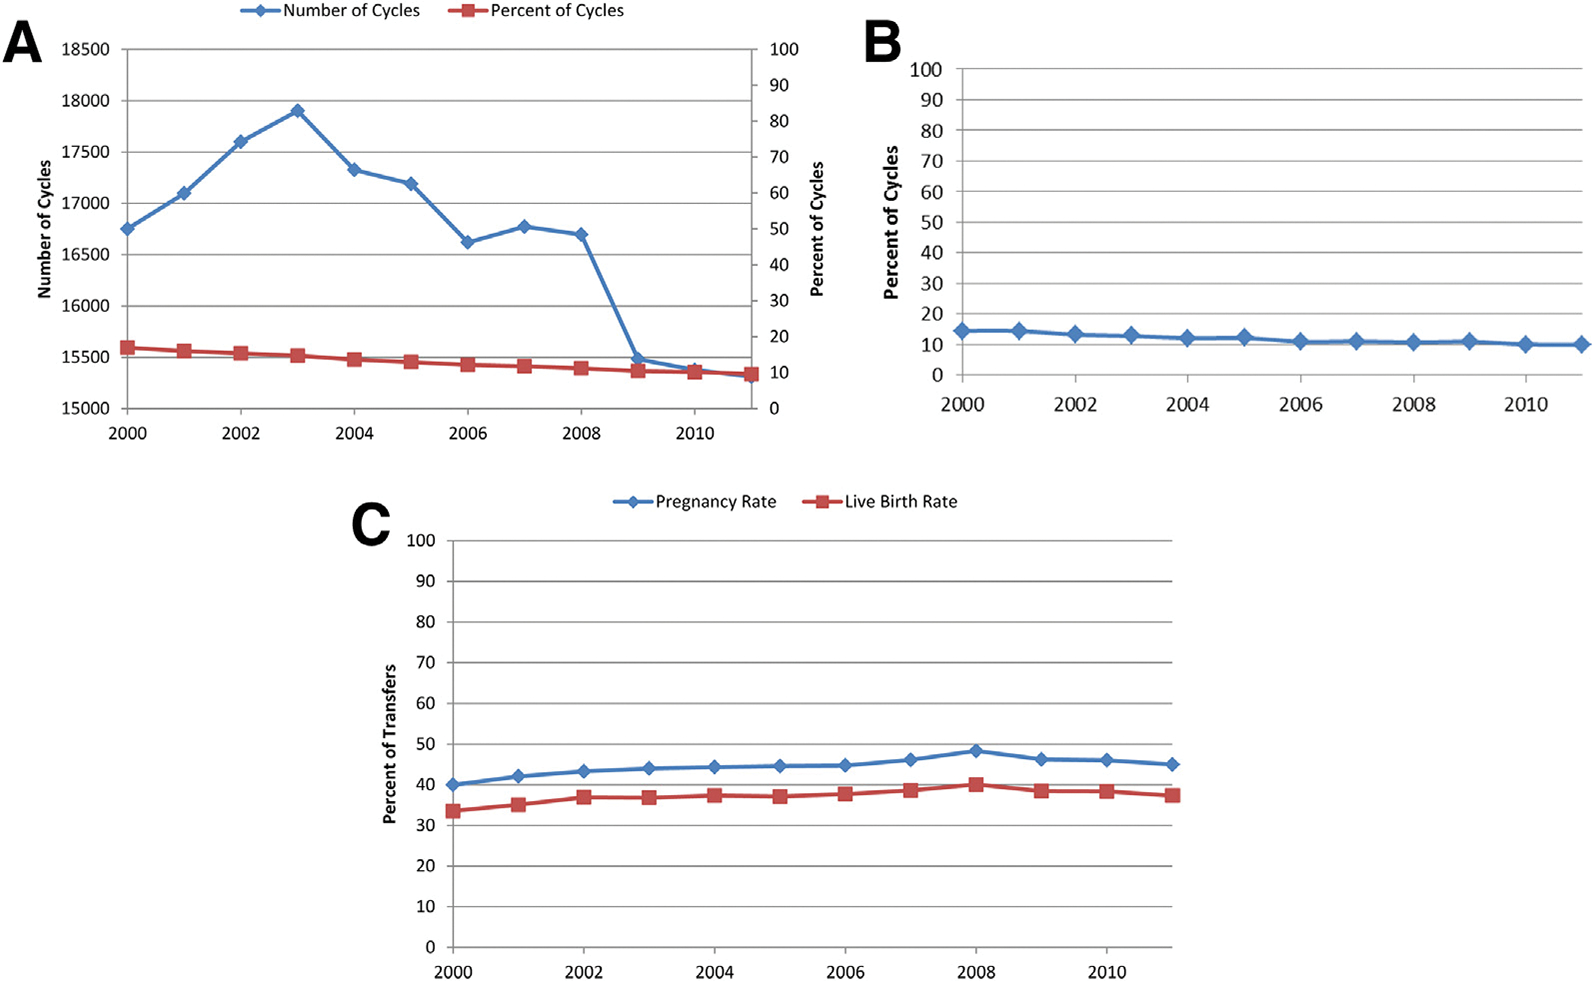
(A) Absolute number and percentage of all ART cycles including a diagnosis of endometriosis, 2000–2011. (B) Percentage of fresh ART cycles including any diagnosis of endometriosis that were cancelled, 2000–2011. (C) Pregnancy and live birth rates for all fresh, non-donor transfers with any diagnosis of endometriosis, 2000–2011.