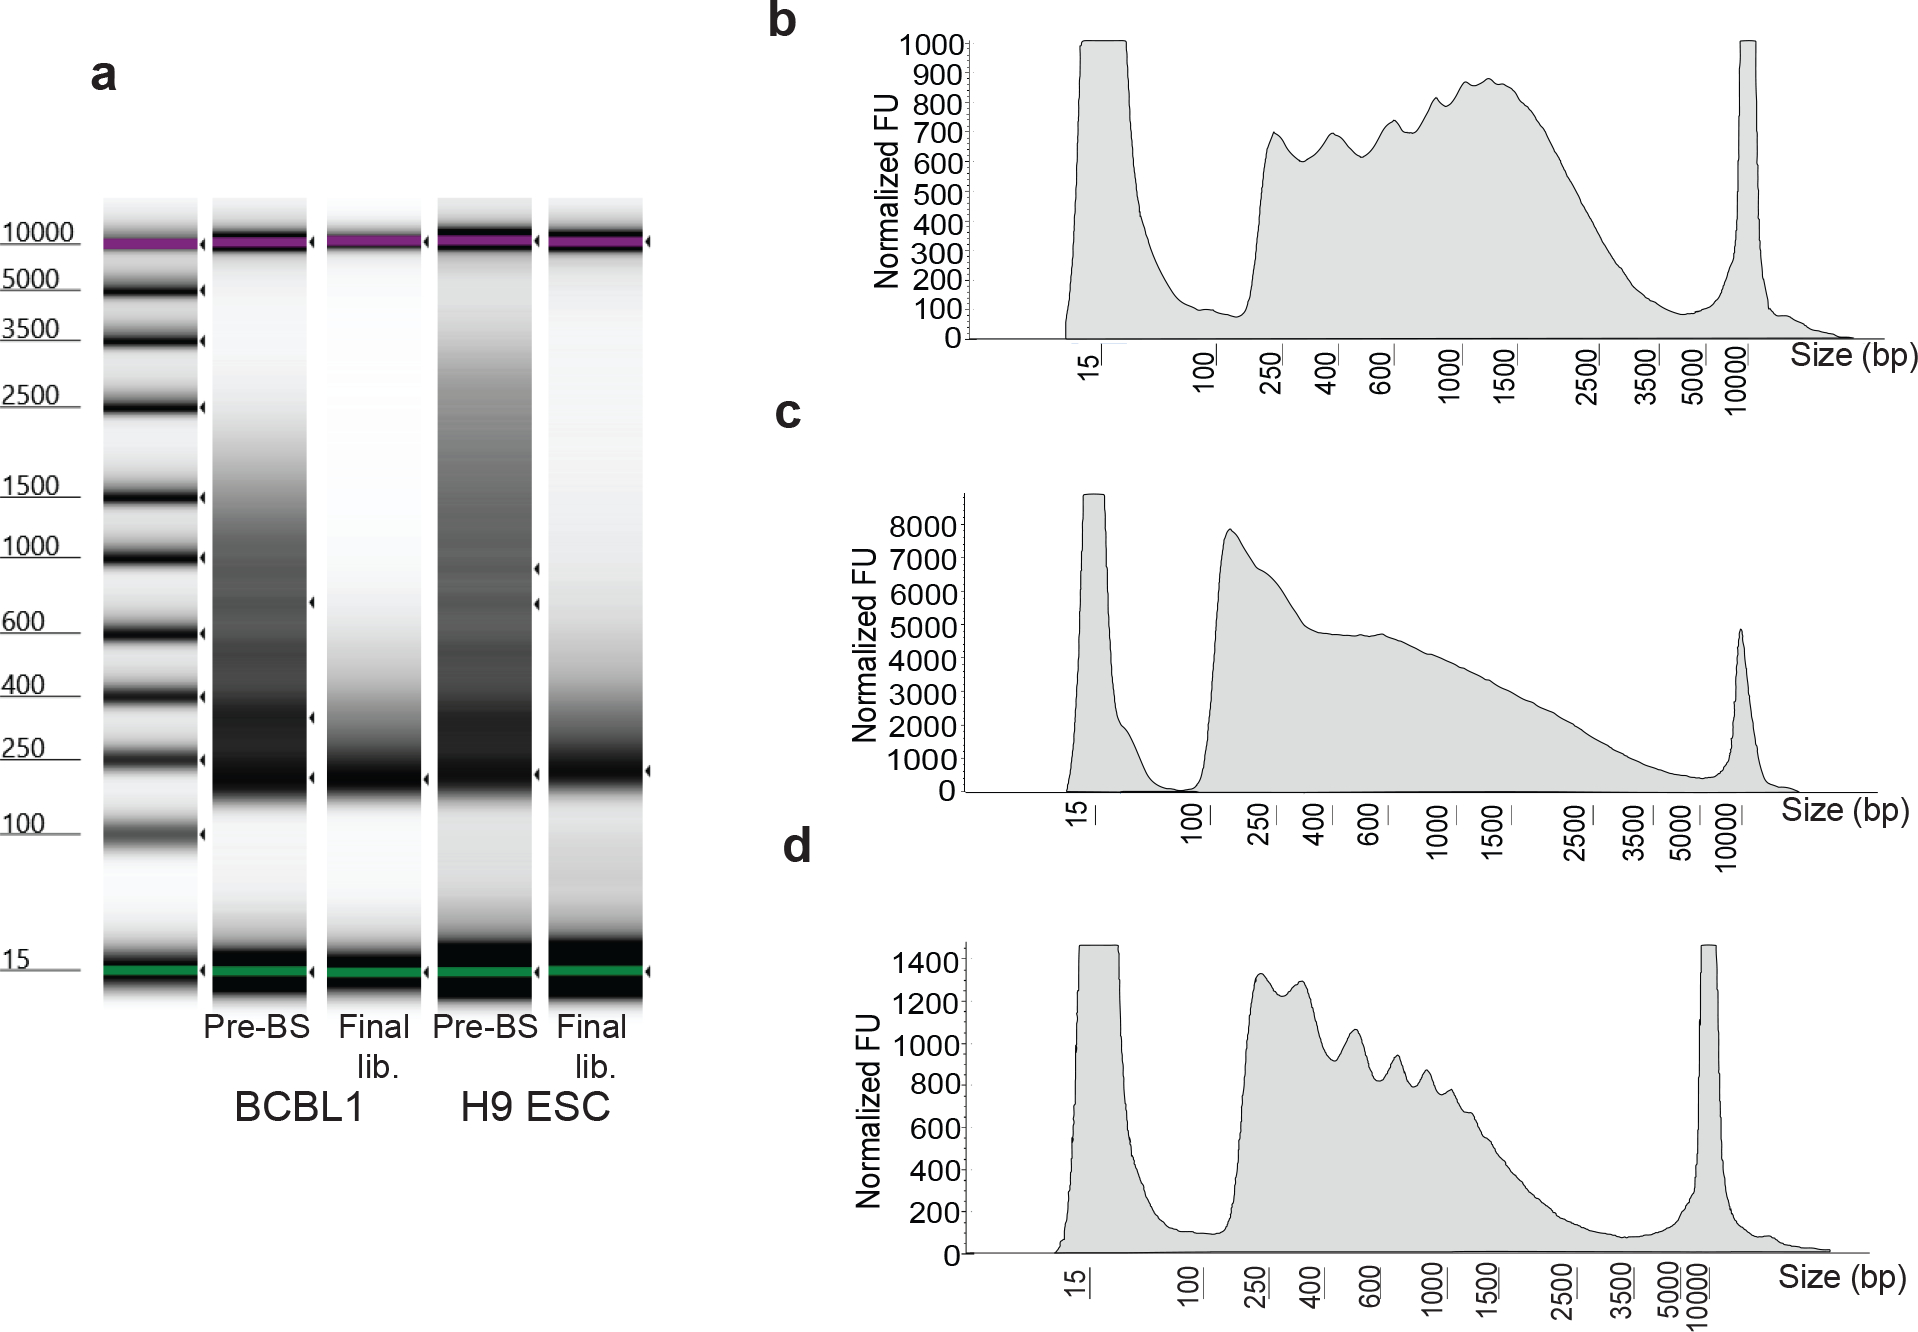
Figure 2. Fragment distribution at quality check steps.

Representative fragment distribution of amplified libraries following gap repair (steps 35–38; before bisulfite treatment, pre-BS) and bisulfite conversion (steps 59–69; final lib.) of two different cell types including H9 embryonic stem cells grown as a monolayer on Matrigel and non-adherent BCBL1 cells grown in suspension (a). Gel-like images are captured from Agilent Tape Station results files. This step is a key quality control checkpoint to assess tagmentation quality. Prior to bisulfite conversion, high quality libraries should display distinct banding patterns resembling the characteristic nucleosome ladder (pre-BS), whereas lower quality libraries display a more diffuse fragment distribution. The banding pattern is diminished, and larger fragments are lost following bisulfite treatment and PCR (final lib). Over- and under-tagmentation of chromatin accessible fragments are common issues which may require optimization on a per cell type or per condition basis. Traces of electropherogram profiles of example pre-BS amplifications are shown (b-d). y-axis displays normalized fluorescence units (FU). Fragment distributions resulting from under-tagmentation are characterized by an accumulation of large fragments (b), whereas over-tagmentation is characterized by a loss of nucleosomal banding (c). An ideal tagmentation reaction preserves nucleosomal banding while also reducing the accumulation of large fragments (d).
